Key Takeaways
- Mountain STR markets command a median ADR of $563 compared to $383 for coastal markets, but mountain entry prices run 2.3 times higher on average ($1.58M vs. $641K).
- Coastal markets average 59% annual occupancy versus 50% for mountain markets, and all six tracked coastal markets clear a 1.0 DSCR at 75% LTV. Only 1 of 9 mountain markets (Mammoth Lakes) does the same.
- Both categories show sharp seasonality, but mountain markets often benefit from dual-peak demand (ski season plus summer), while coastal markets concentrate 50% or more of revenue into June through August.
- For investors focused on cash flow and DSCR qualification, coastal markets offer a significantly easier path. For investors prioritizing appreciation and premium nightly rates, mountain markets hold the advantage.
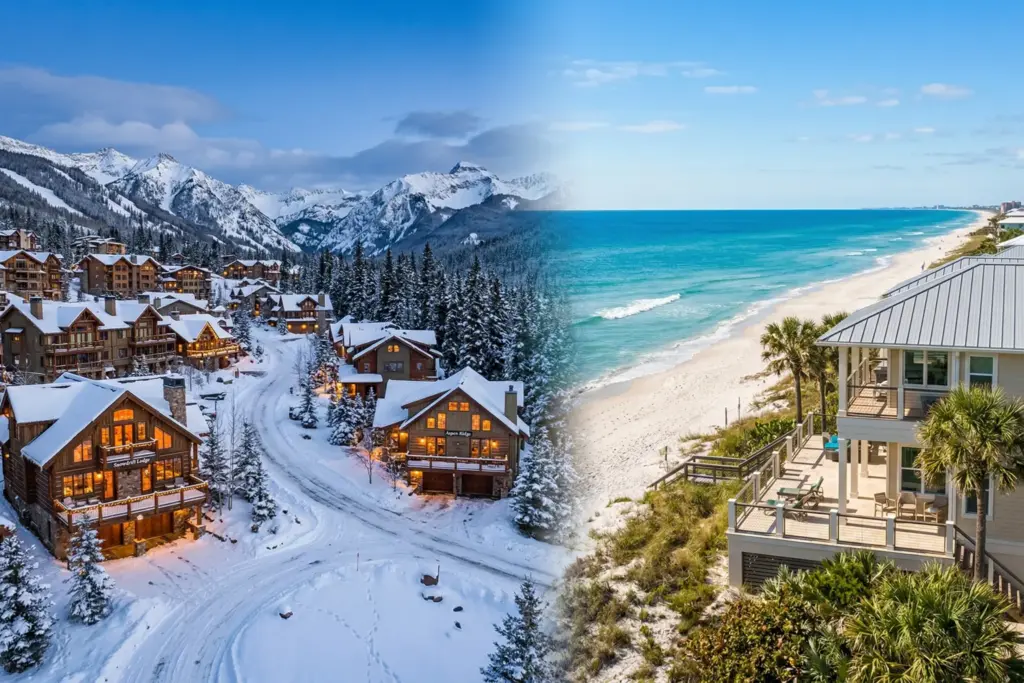
Mountain short-term rental markets average $478 in nightly rate across nine tracked destinations, while six major coastal markets average $437. That 9% gap in ADR sounds modest until you look at the price tag attached to it: the typical mountain STR property costs $1.58 million, compared to $641,000 on the coast. I have spent forty years watching numbers tell stories that the headlines miss, and the story in this dataset is not about which geography charges more per night. It is about which one lets you keep more of what you earn.
StaySTRA now tracks comprehensive market data for nine mountain destinations and dozens of coastal markets. This is the first time we have had enough data across both categories to build an honest, apples-to-apples comparison. I pulled the numbers from every StaySTRA location page and published market article in both categories, and the patterns are clear enough to act on.
The Full Comparison Table
Stay with me through this table. It is the backbone of everything that follows.
Mountain Markets
| Market | ADR | Occupancy | Est. Annual Revenue | Home Price | Gross Yield |
|---|---|---|---|---|---|
| Jackson Hole, WY | $589 | 46.9% | $78,821 | $1,850,000 | 4.3% |
| Big Sky, MT | $594 | 56.0% | $125,000 | $1,643,000 | 7.6% |
| Telluride, CO | $663 | 37.5% | $62,379 | $1,915,000 | 3.3% |
| Steamboat Springs, CO | $392 | 54.6% | $54,648 | $1,138,000 | 4.8% |
| Aspen, CO | $640 | 46.5% | $87,500 | $3,218,000 | 2.7% |
| Vail, CO | $563 | 47.1% | $64,008 | $1,627,000 | 3.9% |
| Mammoth Lakes, CA | $295 | 60.0% | $79,295 | $787,000 | 10.1% |
| Sun Valley, ID | $274 | 46.0% | $45,000 | $1,114,000 | 4.0% |
| Bend, OR | $294 | 55.6% | $44,232 | $726,000 | 6.1% |
| Mountain Average | $478 | 50.0% | $71,209 | $1,580,000 | 5.2% |
Coastal Markets
| Market | ADR | Occupancy | Est. Annual Revenue | Home Price | Gross Yield |
|---|---|---|---|---|---|
| Outer Banks, NC | $357 | 71.3% | $62,016 | $699,000 | 8.9% |
| Hilton Head, SC | $307 | 69.2% | $55,440 | $773,000 | 7.2% |
| Myrtle Beach, SC | $262 | 65.0% | $50,000 | $302,000 | 16.6% |
| Key West, FL | $903 | 49.0% | $143,412 | $1,005,000 | 14.3% |
| Palm Springs, CA | $423 | 60.0% | $63,360 | $620,000 | 10.2% |
| Gulf Shores, AL | $369 | 41.3% | $39,384 | $446,000 | 8.8% |
| Coastal Average | $437 | 59.3% | $68,935 | $641,000 | 10.8% |
Source: StaySTRA location pages and published market articles, LTM (last twelve months) data as of Q1 2026. Home prices via Zillow typical home value estimates.
What the ADR Gap Really Means (and What It Hides)
Think of ADR like the sticker price on a car at the dealership. A $640 nightly rate in Aspen sounds wonderful on paper, the same way a luxury sedan looks great in the showroom. But nobody evaluates a car purchase by the sticker price alone. You look at the total cost of ownership.
Mountain markets do command higher nightly rates. Telluride leads at $663, followed by Aspen at $640 and Big Sky at $594. On the coastal side, Key West is the outlier at $903, but remove that one market and the coastal average drops to $344.
The catch is that high ADR in mountain markets comes paired with lower occupancy. Telluride runs just 37.5% annual occupancy. Aspen sits at 46.5%. Compare that to the Outer Banks at 71.3% or Hilton Head at 69.2%. A $663 nightly rate at 37.5% occupancy generates less annual revenue than a $357 rate at 71.3% occupancy. The Outer Banks property earns roughly the same annual revenue as Telluride, but on a home that costs a third as much.
Occupancy: Where Coastal Markets Pull Away
Coastal markets average 59.3% annual occupancy across our six tracked markets. Mountain markets average 50.0% across nine. That gap of nearly 10 percentage points makes a real difference in revenue consistency.
The highest-occupancy mountain market is Mammoth Lakes at 60%, which is actually below four of the six coastal markets. Big Sky (56%) and Bend (55.6%) are the next strongest mountain performers. On the coastal side, the Outer Banks leads the entire dataset at 71.3%, and Hilton Head follows at 69.2%.
Don’t let the occupancy numbers scare you away from mountains entirely, though. A 50% occupancy rate with a $478 average nightly rate still produces meaningful revenue. The question is whether that revenue justifies the acquisition cost, and that is where the math starts to diverge.
Seasonality: Two Very Different Rhythms
Here in Santa Fe, I watch both patterns from my window. Ski season fills the roads heading north toward Taos every December, and the summer monsoon brings a completely different crowd. Mountain and coastal STR markets follow similar dual rhythms, but with important structural differences.
Mountain seasonality follows a ski-peak pattern. Steamboat Springs hits 91.3% occupancy in February at a $604 ADR, generating $11,790 in monthly revenue. By May, that same property might pull $2,000. That is roughly a 6:1 swing from peak to trough. Vail shows the same pattern: $14,073 in February revenue versus sub-$3,000 months in the shoulder seasons.
Coastal seasonality follows a summer-peak pattern. Outer Banks properties in Corolla hit 95% occupancy in June, generating $11,277 monthly. By January, revenue drops to around $1,500. That is roughly a 7.5:1 swing.
The operational difference is this: many mountain markets get a meaningful second peak in summer. Jackson Hole earns $13,859 per month in summer, nearly matching its ski season. Bend generates 90.3% occupancy in July, functioning primarily as a summer outdoor recreation market. Coastal markets rarely get an equivalent winter bump. Hilton Head has mild winters and maintains some traffic, but most beach markets go quiet from November through March.
For investors who want to manage fewer vacancy months, mountain markets with strong dual seasons (Jackson Hole, Big Sky, Bend) spread revenue more evenly across the calendar. For investors who want predictable peak-season cash flow and can tolerate a quiet winter, coastal markets deliver a concentrated summer windfall.
DSCR Math: Where the Decision Gets Made
This is where I ask you to stick with me, because the DSCR calculation is where abstract comparisons become concrete investment decisions.
DSCR (debt service coverage ratio) measures whether a property’s rental income covers its mortgage payment. A 1.0 DSCR means the property breaks even on debt service. Most lenders require 1.0 to 1.25 for STR DSCR loans. Here is how the two categories stack up at 75% LTV with a 7.5% interest rate on a 30-year term:
Coastal DSCR performance:
- Myrtle Beach: $302K home, $226K loan, $19K annual debt service, $50K revenue = 2.64 DSCR
- Key West: $1.005M home, $754K loan, $63K debt service, $143K revenue = 2.27 DSCR
- Palm Springs: $620K home, $465K loan, $39K debt service, $63K revenue = 1.63 DSCR
- Outer Banks: $699K home, $524K loan, $44K debt service, $62K revenue = 1.41 DSCR
- Gulf Shores: $446K home, $335K loan, $28K debt service, $39K revenue = 1.40 DSCR
- Hilton Head: $773K home, $580K loan, $49K debt service, $55K revenue = 1.14 DSCR
All six coastal markets clear a 1.0 DSCR at standard leverage.
Mountain DSCR performance:
- Mammoth Lakes: $787K home, $590K loan, $49K debt service, $79K revenue = 1.60 DSCR
- Bend: $726K home, $545K loan, $46K debt service, $44K revenue = 0.97 DSCR
- Steamboat Springs: $1.138M home, $854K loan, $72K debt service, $55K revenue = 0.77 DSCR
- Sun Valley: $1.114M home, $836K loan, $70K debt service, $45K revenue = 0.64 DSCR
- Jackson Hole: $1.85M home, $1.39M loan, $116K debt service, $79K revenue = 0.68 DSCR
- Aspen: $3.218M home, $2.41M loan, $202K debt service, $88K revenue = 0.43 DSCR
Only one mountain market (Mammoth Lakes) clears 1.0 DSCR at 75% LTV. Bend comes close at 0.97. The rest require 40% or more down payment to qualify, and several (Aspen, Sun Valley) do not pencil as cash-flow investments at any reasonable leverage.
Sponsored — Beeline
Finance Your Next STR With a DSCR Loan
Qualify on property cash flow, not W-2 income. Beeline specializes in fast DSCR closings for STR investors. No personal income verification required.
Check Your DSCR Eligibility →Affiliate disclosure: StaySTRA may earn a referral fee.
Entry Price: The First-Time Investor Question
If you are buying your first STR investment property, the entry price question is not abstract. Coastal markets offer five options under $800,000: Myrtle Beach ($302K), Gulf Shores ($446K), Palm Springs ($620K), the Outer Banks ($699K), and Hilton Head ($773K). That means a 25% down payment ranges from $75,500 to $193,250.
Mountain markets offer two options under $800,000: Bend ($726K) and Mammoth Lakes ($787K). Every other mountain market in our dataset requires over $1 million to enter, and the median mountain home price is $1.627 million. A 25% down payment at the mountain median is $407,000.
Think of it like choosing between two neighborhoods in the same city. The expensive neighborhood might appreciate faster, but you need to actually get through the front door first. For most first-time investors, coastal markets provide a wider selection of doors to walk through.
Top Performers in Each Category
Highest occupancy, mountain: Mammoth Lakes at 60%, followed closely by Big Sky (56%) and Bend (55.6%).
Highest occupancy, coastal: Outer Banks at 71.3%, then Hilton Head (69.2%) and Myrtle Beach (65%).
Highest revenue, mountain: Big Sky at $125,000 annual, driven by strong ski-season demand and limited supply (the town caps STR permits).
Highest revenue, coastal: Key West at $143,412 annual, though its licensing moratorium means you cannot easily add new supply.
Best yield, mountain: Mammoth Lakes at 10.1% gross, thanks to strong year-round occupancy and the most affordable entry price among California mountain markets.
Best yield, coastal: Myrtle Beach at 16.6% gross, driven by the lowest entry price in our entire dataset at $302,000.
StaySTRA data from our summer 2026 forward booking analysis shows mountain markets with dual seasons (particularly Bend and Jackson Hole) are already seeing strong Q2 demand. Coastal markets along the Southeast coast are filling rapidly for June and July.
Which Category Fits Your Strategy?
Choose coastal if: You prioritize cash flow, DSCR loan qualification, lower capital requirements, and higher occupancy rates. You are comfortable with seasonal concentration (earning 50%+ of revenue in a 3-4 month window). You want a wider selection of entry-price options under $800,000.
Choose mountain if: You prioritize premium nightly rates, long-term appreciation in supply-constrained markets, and dual-season revenue potential. You can bring 35% or more as a down payment. You view the property as a wealth-building asset first and a cash-flow asset second.
The hybrid approach: Some of the savviest investors I have spoken with over the years hold one of each. A coastal property that cash-flows and qualifies for DSCR financing, paired with a mountain property purchased with more equity that appreciates in a constrained market. The coastal property funds the portfolio while the mountain property builds long-term value.
We do our best to keep our data accurate and up to date, but markets move fast and we are only human. Always verify current figures directly with local sources before making investment decisions.
Frequently Asked Questions
Which STR market type has higher average daily rates in 2026, mountain or coastal?
Mountain markets average $478 ADR across nine tracked destinations, compared to $437 for six coastal markets. The highest individual ADR belongs to Key West (coastal) at $903, but the mountain category as a whole commands premium nightly rates, led by Telluride ($663), Aspen ($640), and Big Sky ($594).
Are mountain or coastal STR markets better for DSCR loans?
Coastal markets are significantly more DSCR-friendly. All six tracked coastal markets clear a 1.0 DSCR at 75% LTV and 7.5% interest. Only one mountain market (Mammoth Lakes) achieves the same. Most mountain markets require 40% or more down payment to qualify for DSCR financing due to high acquisition costs relative to rental income.
What is the best mountain STR market for first-time investors in 2026?
Bend, Oregon ($726K median home, 55.6% occupancy, $294 ADR) and Mammoth Lakes, California ($787K median home, 60% occupancy, 10.1% gross yield) offer the most accessible mountain entry points. Both markets have strong year-round demand and fall under $800,000 for a typical acquisition.
Do mountain STR markets have worse seasonality than coastal markets?
Both categories experience sharp seasonal swings, with 6:1 to 7.5:1 peak-to-trough revenue ratios. The key difference is that many mountain markets benefit from dual-peak seasons (ski winter and active summer), while most coastal markets concentrate revenue heavily into June through August with limited winter demand.
Which coastal STR market has the highest gross yield in 2026?
Myrtle Beach, South Carolina leads with a 16.6% gross yield, driven by a $302,000 median home price and approximately $50,000 in estimated annual revenue. Key West follows at 14.3%, though it requires a $1 million entry price and faces a licensing moratorium on new STR permits.
Run Your Own Numbers
Every market in both tables above has a detailed StaySTRA analysis behind it. Run the numbers for any specific mountain or coastal market using the StaySTRA Analyzer to see property-level revenue projections, occupancy patterns, and DSCR calculations tailored to your target investment.
Become a StaySTRA Insider
Join free — get our newsletter + 1 free property analysis/month.
No spam. Unsubscribe anytime. Free membership includes property analyses and market insights.


