Key Takeaways
- StaySTRA tracks 17,148 active short-term rental listings in Myrtle Beach, with a last-twelve-month ADR of $198 and occupancy of 58.1%, producing average monthly revenue of $2,595 per listing.
- Seasonality is extreme. July revenue ($6,091 per listing) is 6.6 times higher than January ($923), meaning roughly 60% of annual income arrives during a 14-week summer window.
- The combined Myrtle Beach and North Myrtle Beach corridor holds more than 26,000 active STR listings for a metro population under 60,000, making it one of the densest vacation rental markets in the country.
- Myrtle Beach prohibits short-term rentals in all traditional residential zones (any R-prefix district except RMV), so investors must target commercial or visitor-zoned properties.
- Entry costs are significantly lower than competing beach markets. Myrtle Beach’s $198 ADR compares to $348 in Destin and $276 in Panama City Beach, but so is the revenue ceiling.
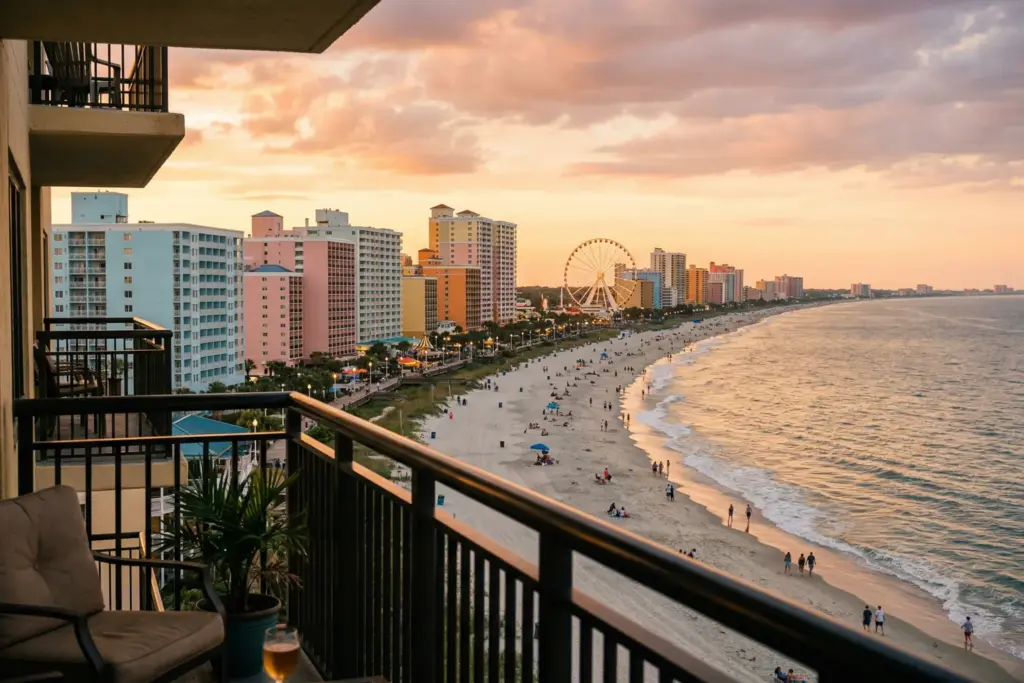
Walk the boardwalk in Myrtle Beach on a Saturday morning in July and the place hums. The SkyWheel turns slowly against a flat blue sky, the smell of funnel cake drifts over from the pier, and every balcony on Ocean Boulevard has a towel draped over the railing. This is the Grand Strand doing what it does best: absorbing people. Eighteen million visitors a year pour into a stretch of coastline that runs about sixty miles from Little River down to Pawleys Island, and most of them come between Memorial Day and Labor Day.
For short-term rental investors, that number sounds like a dream. Dieciocho millones (eighteen million). It is a staggering amount of demand concentrated in one place. But the question nobody answers with a bumper sticker is this: what happens to your investment during the other eight months?
I have been looking at the Myrtle Beach short-term rental market 2026 data, and the picture is both compelling and honest. The numbers tell a clear story about opportunity, but they also tell a story about rhythm. This is a market that breathes with the seasons, and investors who understand that breathing pattern will do better than those who fight it.
Sponsored — Beeline
Finance Your Next STR With a DSCR Loan
Qualify on property cash flow, not W-2 income. Beeline specializes in fast DSCR closings for STR investors. No personal income verification required.
Check Your DSCR Eligibility →Affiliate disclosure: StaySTRA may earn a referral fee.
Myrtle Beach STR Market Overview: The Numbers Right Now
StaySTRA data tracks 17,148 active short-term rental listings in the Myrtle Beach market. That is an enormous number for a city with a permanent population of 39,697. The ratio is roughly one STR listing for every 2.3 residents. For context, Gatlinburg, Tennessee, which we recently profiled as America’s most cabin-dense STR market, runs about 1.73 listings per person. Myrtle Beach is not quite at that level in per-capita terms, but the sheer volume of 17,000-plus listings puts it in the same conversation about supply density.
Here is what the last twelve months of performance data look like across those 17,148 listings:
- LTM Average Daily Rate: $198
- LTM Occupancy Rate: 58.1%
- LTM Average Monthly Revenue: $2,595
- Estimated Annual Revenue: $31,140 per listing
Those are market-wide averages. The median property in Myrtle Beach is a one or two-bedroom condo (studios, one-bedrooms, and two-bedrooms account for 11,349 of those 17,148 listings). Larger houses with ocean views command significantly higher rates, but the typical investor here is buying a condo unit, not a beach house.
When you expand the frame to include North Myrtle Beach, the corridor grows to more than 26,000 active listings. North Myrtle Beach runs a higher ADR ($270 LTM) and slightly better occupancy (60%), producing $3,692 in monthly revenue per listing. The difference largely comes down to property mix. North Myrtle Beach skews toward larger homes and multi-bedroom beach houses, while the city of Myrtle Beach leans heavily toward condo inventory.
The Seasonal Revenue Pattern: Where the Real Story Lives
This is where the Myrtle Beach Airbnb market 2026 conversation gets honest. The monthly data reveals one of the most dramatic seasonal swings in any US beach market.
| Month | ADR | Occupancy | Monthly Revenue |
|---|---|---|---|
| July 2024 | $267 | 90.3% | $6,091 |
| August 2024 | $234 | 75.0% | $4,493 |
| June 2025 | $262 | 83.3% | $5,386 |
| May 2025 | $225 | 58.1% | $3,400 |
| April 2025 | $200 | 63.3% | $3,074 |
| March 2025 | $170 | 61.3% | $2,503 |
| October 2024 | $161 | 50.0% | $2,058 |
| September 2024 | $185 | 56.0% | $2,530 |
| November 2024 | $148 | 34.5% | $1,338 |
| February 2025 | $142 | 42.9% | $1,285 |
| December 2024 | $135 | 32.3% | $1,109 |
| January 2025 | $133 | 29.0% | $923 |
Read that table from top to bottom and the story writes itself. July revenue ($6,091) is 6.6 times what January produces ($923). The four peak months of June through September generate roughly $18,500 in combined revenue. The remaining eight months produce about $12,700. That means roughly 59% of annual income arrives in a 14-week window.
Walking through the Grand Strand in February, I could not help but notice the difference. The pool decks are empty. The putt-putt courses are closed. The condos along Ocean Boulevard show the blue glow of vacant unit hallway lights, one after another. Es otra ciudad (it is another city). That winter quiet is not a problem to solve. It is a feature of this market that investors need to price into their models from day one.
How Myrtle Beach Compares to Other Beach Markets
Investors often weigh Myrtle Beach against Gulf Coast alternatives. Our Gulf Coast STR market comparison provides detailed breakdowns of those markets, and the contrast with Myrtle Beach is instructive.
| Market | Active Listings | LTM ADR | LTM Occupancy | Monthly Revenue |
|---|---|---|---|---|
| Myrtle Beach, SC | 17,148 | $198 | 58.1% | $2,595 |
| North Myrtle Beach, SC | 9,071 | $270 | 60.0% | $3,692 |
| Destin, FL | 3,599 | $348 | 66.7% | $5,488 |
| Panama City Beach, FL | 12,244 | $276 | 57.7% | $3,803 |
| Gulf Shores, AL | 5,182 | $305 | 61.3% | $4,606 |
Myrtle Beach sits at the bottom of this group on ADR and monthly revenue, but it also sits at the top on volume. With 17,148 listings in the city alone (26,000-plus in the corridor), this is by far the largest inventory among comparable beach STR markets. That volume is both a feature and a challenge. The demand is real, verified by 18.1 million annual visitors. But the supply is enormous, which puts downward pressure on rates and forces operators to compete harder on listing quality, pricing strategy, and guest experience.
Destin generates more than double the monthly revenue of a typical Myrtle Beach listing, but Destin property prices are also considerably higher. The investors I talk to who compare these markets are not always looking at the same equation. A two-bedroom oceanfront condo in Myrtle Beach might cost $250,000 to $350,000. The equivalent in Destin often starts north of $500,000. The lower entry point in Myrtle Beach is a genuine advantage for first-time investors working with limited capital.
Regulatory Environment: What Investors Need to Know Before Buying
The regulatory picture in Myrtle Beach is more nuanced than most beach markets, and it is the piece that catches first-time investors off guard.
Zoning Restrictions
This is the most important rule to understand. The City of Myrtle Beach prohibits short-term rentals in all traditional residential zones. Any zoning district that starts with “R” does not allow STRs, with one exception: the RMV (Residential Multifamily Visitor) zone. Permitted zones for vacation rentals include RMV, MU-H, C6, A, E, HC1, HC2, and (by special exception) IR districts.
In practical terms, this means the STR inventory clusters along the oceanfront commercial corridor and in purpose-built resort condo complexes. Investors who see a cheap house a few blocks off the beach and think “vacation rental” need to check the zoning before writing an offer. Most of those neighborhoods are R-zoned and off limits.
Business License and Taxes
Operators must obtain a City of Myrtle Beach business license, renewed annually before April 30. The license fee is calculated as a percentage of total revenue generated. On top of that, operators must collect and remit three layers of tax:
- Local accommodations tax: 3% (the maximum allowed under South Carolina law)
- Horry County hospitality fee: collected separately, remitted to the county
- South Carolina state lodging tax: collected and remitted to the state
There is a small exemption: if you rent fewer than 15 days per year or rent six or fewer bedrooms in an owner-occupied home (not through a platform like Airbnb), you may skip the local accommodations tax. For any serious investor, this exemption does not apply.
The HOA Factor
This is where many Myrtle Beach investment deals quietly die. Because the market is dominated by condo complexes, HOA and condo association rules become the real gatekeepers. A property can be in a perfectly legal STR zone, with all the right permits, and still be restricted from short-term renting by the building’s HOA.
Some associations welcome vacation rentals and have management companies built into their structure. Others have banned them outright, sometimes after years of allowing them. The shift often happens when owner-occupants gain a board majority and vote to restrict rentals. Before putting money on any condo unit, investors need to review the association’s covenants, conditions, and restrictions (CC&Rs) in detail. Not the summary. The actual document. No se confie (do not take it on faith).
The Conversion Ordinance
In early 2025, Myrtle Beach passed an ordinance that actually protects STR inventory. The law prohibits buildings with more than two STR units (in commercial zones east of Kings Highway to the ocean, covering about 114 city blocks) from converting to long-term rentals. The city’s reasoning was financial: converting 1,000 STR units to long-term would cost the city an estimated $2.48 million in lodging tax revenue, with total losses across all jurisdictions reaching $7.61 million.
This is an unusual move. Most cities are trying to limit STRs. Myrtle Beach is protecting them, because the local economy depends on them. That tells you something important about this market’s relationship with tourism.
Property Types and Revenue Tiers
The Myrtle Beach STR inventory breaks down into clear tiers, each with a different investment profile.
Studios and one-bedrooms (6,345 listings, 37% of market): These are the entry-level play. Most are condo units in high-rise complexes along the oceanfront. Lower ADR, lower revenue, but also the lowest capital requirement. Think $150,000 to $250,000 purchase price, generating $20,000 to $30,000 in annual gross revenue.
Two-bedrooms (5,004 listings, 29% of market): The sweet spot for many investors. These units attract both couples and small groups, extending the booking window into shoulder season. The two-bedroom segment likely outperforms the market average on occupancy because of its flexibility.
Three-bedrooms and above (4,043 listings, 24% of market): Larger units and beach houses that command premium rates during peak season. A well-located three-bedroom oceanfront unit can generate $5,000 or more per month during summer, but winter months may see revenue drop below $1,500.
Five-plus bedrooms (713 listings, 4% of market): The niche play. Large beach houses that target group travel, reunions, and multi-generational trips. Highest peak revenue, but also the highest carrying costs and the hardest to fill during the off-season.
The Investment Case: Strengths and Honest Concerns
What Works in Myrtle Beach
Volume and proven demand. Eighteen million visitors is not a speculative number. The Grand Strand has been a destination for generations. This is not a market where you are betting on future tourism growth. The infrastructure, the highway access (I-95 to US-17, plus Myrtle Beach International Airport), and the cultural identity are already built.
Affordable entry. Compared to Destin, the Outer Banks, or Hilton Head, Myrtle Beach offers significantly lower acquisition costs. That lower barrier matters for investors using DSCR financing, where the debt service coverage ratio improves with a smaller mortgage relative to income.
Booking window patterns. StaySTRA data shows that 64.2% of bookings happen one to three months in advance, with another 58.7% in the four-to-six month window. This gives operators reasonable forecasting ability for the peak season and time to adjust pricing strategy.
What Gives Investors Pause
Seasonality compression. The 6.6x revenue gap between July and January is significant. An investor whose mortgage, HOA, insurance, and management fees total $2,000 per month will lose money five or six months of the year. The summer profits need to cover those winter losses and then some. This is math you must run before buying, not after.
Competition density. With 17,148 listings, the supply side is saturated. Standing out requires professional photography, dynamic pricing, quick response times, and genuine attention to guest experience. Passive investing does not work well here. The hosts who treat their listing like a business do fine. The ones who set it and forget it get buried in search results.
HOA unpredictability. As discussed above, condo association rules can change. An investment that cash-flows beautifully today can become a non-rental property if the HOA votes to restrict short-term stays. This risk is not hypothetical. It has happened in multiple Myrtle Beach complexes, and investors who were not paying attention to board politics paid the price.
Neighborhood and Corridor Context
The Grand Strand is not one market. It stretches across several distinct areas, each with its own character and investor profile.
Myrtle Beach (city proper): The highest density of listings, the most competitive pricing, and the most accessible entry point. The oceanfront corridor east of Kings Highway is where the STR-zoned inventory concentrates. This is tourist Myrtle Beach: the boardwalk, the restaurants, the attractions.
North Myrtle Beach: Quieter, more residential feel, higher ADRs. The 9,071 listings here skew toward larger properties (three-plus bedrooms dominate the inventory). Guests tend to be groups looking for a more relaxed beach experience. Revenue per listing runs about 42% higher than the city of Myrtle Beach.
Surfside Beach and Garden City: South of the city, these areas offer a more laid-back atmosphere with slightly less commercial intensity. Smaller inventory, but also less competition per listing.
Pawleys Island and Litchfield Beach: The southern anchor of the Grand Strand. More upscale, less tourist-focused, and with stronger year-round appeal from the golf corridor. Properties here tend to be higher-priced but also command premium rates.
What This Market Asks of You
There is a phrase in Spanish, hay que saber bailar con la musica que toca, which means you have to dance with the music that is playing. Myrtle Beach plays a seasonal song, and the investors who succeed here are the ones who know the rhythm.
That means pricing aggressively during peak season, not leaving money on the table in July because you set a flat rate in January. It means dropping rates strategically in the off-season to maintain some occupancy rather than sitting empty. It means understanding that your January and February might produce $900 a month, and that is okay, because your June and July will produce $5,000 to $6,000.
The investors who struggle here are the ones who look at the $31,140 annual average and divide by twelve, expecting $2,595 every month. That is not how this market works. Year-round markets like Tampa offer more consistent monthly income. Myrtle Beach offers higher peak returns with real valleys in between.
For the right investor, someone with enough reserves to weather the off-season, the discipline to manage pricing actively, and the patience to let summer do the heavy lifting, this market still works. The demand is not going anywhere. The 18.1 million visitors will keep coming. The question is whether your financial model and your temperament match the rhythm.
We do our best to keep our content accurate and up to date, but things change and we are only human. Always verify details directly with local sources before making decisions.
Frequently Asked Questions
Is Myrtle Beach a good market for short-term rental investment in 2026?
Myrtle Beach can be a solid STR investment for buyers who understand its seasonal nature. StaySTRA data shows the average listing generates $31,140 in annual revenue across a 58.1% occupancy rate. The key challenge is that roughly 60% of that income arrives during a 14-week summer window, so investors need financial reserves to cover off-season carrying costs. Entry prices are lower than most comparable beach markets, which helps the math work for buyers with smaller budgets.
What is the average Airbnb income in Myrtle Beach?
According to StaySTRA data, the average Myrtle Beach STR listing produces $2,595 per month in revenue, or approximately $31,140 per year. Peak summer months (June through August) generate $4,500 to $6,100 per listing, while winter months (December through February) drop to $900 to $1,300. North Myrtle Beach listings, which tend to be larger properties, average $3,692 per month ($44,304 annually).
Are short-term rentals allowed in Myrtle Beach condos?
It depends on two things: zoning and the condo association’s rules. The City of Myrtle Beach only allows STRs in specific zones (RMV, MU-H, C6, and a few others). All traditional residential zones (any R-prefix district except RMV) prohibit vacation rentals. Even in a legal zone, the condo’s HOA or association can impose its own restrictions on short-term renting. Always review the building’s CC&Rs and attend a board meeting before buying a condo as an STR investment.
What permits and licenses do I need to operate a short-term rental in Myrtle Beach?
Operators need a City of Myrtle Beach business license (renewed annually before April 30, with the fee based on a percentage of revenue). You must also register for and collect three separate taxes: the city’s 3% local accommodations tax, the Horry County hospitality fee, and the South Carolina state lodging tax. Violations of zoning or business license requirements are misdemeanors with fines up to $500.
How does Myrtle Beach compare to Destin or Panama City Beach for STR investment?
Myrtle Beach offers lower entry costs and higher listing volume (17,148 listings) but lower monthly revenue ($2,595) compared to Destin ($5,488 monthly, 3,599 listings) and Panama City Beach ($3,803 monthly, 12,244 listings). Destin commands the highest ADR ($348 vs. Myrtle Beach’s $198) but requires significantly more capital to enter. Myrtle Beach suits investors with smaller budgets who can manage seasonality, while Destin targets those seeking higher per-unit returns with greater upfront investment.
Run Your Own Numbers
The market averages give you a starting point, but every property is different. A two-bedroom oceanfront condo will perform differently from a three-bedroom unit two blocks from the beach. Use the StaySTRA Myrtle Beach Airbnb Calculator to plug in a specific address and see projected revenue based on comparable properties in the area. You can also explore the full Myrtle Beach STR market data page for monthly breakdowns, property type distributions, and booking pattern data.
The data is there. The question is whether the rhythm fits.
Become a StaySTRA Insider
Join free — get our newsletter + 1 free property analysis/month.
No spam. Unsubscribe anytime. Free membership includes property analyses and market insights.


