

Key Takeaways
- Cash-on-cash return measures your actual annual cash profit divided by the cash you put in at closing. It is the most honest single number in STR investing because it accounts for financing, not just property performance.
- Mountain cabin markets (Gatlinburg TN, Pigeon Forge TN, Blue Ridge GA) offer the strongest case for 8%+ CoC in 2026 because entry prices are moderate and insurance averages around $1,200 per year.
- Coastal Florida markets struggle to pencil at DSCR loan terms. A $600,000 Destin beach house with $10,000 in annual insurance and $9,000 in property taxes requires roughly $490 in average daily rate just to clear 8% CoC, a threshold most mid-range beach houses cannot consistently reach.
- StaySTRA data across five market categories shows average gross annual revenue ranging from $50,006 (urban) to $62,782 (lake markets). But gross revenue is only half the picture. The insurance gap between mountain and coastal markets swings final CoC by 5 to 9 percentage points on the same dollar invested.
- Premium ski resort markets (Vail CO, Park City UT) produce negative cash-on-cash returns at current purchase prices regardless of occupancy levels.
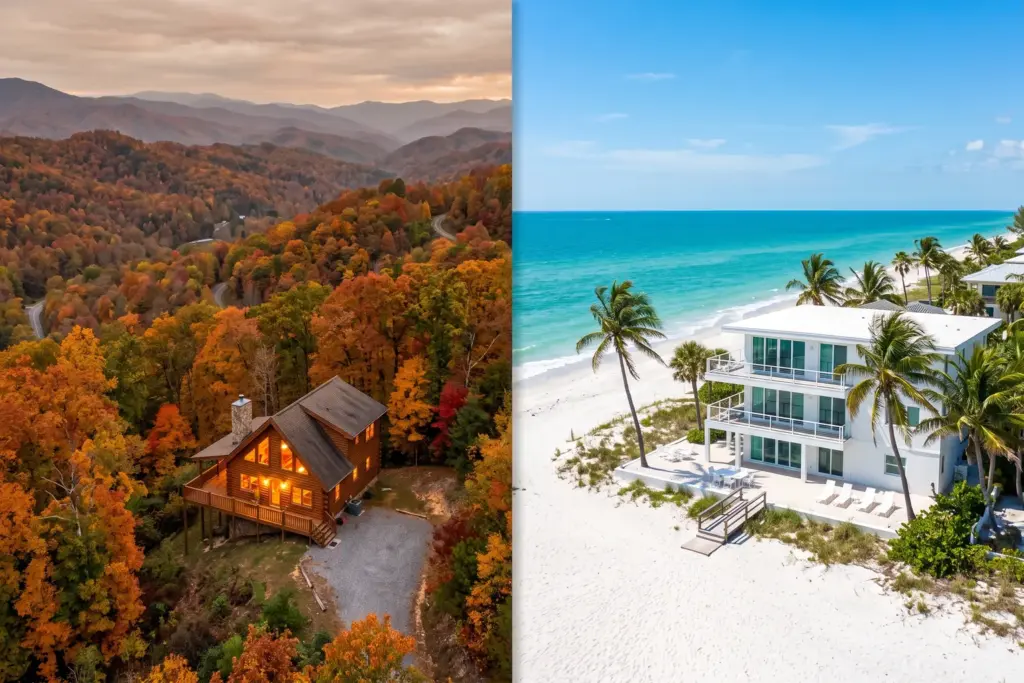
Gatlinburg TN cabin investors buying in the $300,000 to $500,000 range are seeing cash-on-cash returns in the 8 to 12 percent range on quality properties in 2026, according to StaySTRA data. Destin FL beach house buyers at $600,000, with $10,000 annual insurance premiums and $9,000 in property taxes, are not. The math on coastal Florida has tightened to the point where most mid-range beach properties produce negative cash-on-cash returns at today’s DSCR loan rates.
That gap is not about revenue. Both market types generate strong gross income. The difference is what you pay to hold the property, and specifically what you pay to insure it.
This piece walks through the cash-on-cash return formula for STRs, applies it to real markets using StaySTRA data, and gives you a concrete table of which market types actually pencil in 2026 and which ones look better on paper than they are once you factor in the full cost stack.
What Cash-on-Cash Return Actually Means for an STR
Think of cash-on-cash return the way you would think about the interest rate on a savings account. If you put $100,000 into a high-yield account at 5% APY, you earn $5,000 per year in cash. Cash-on-cash return works exactly the same way, except instead of a bank account, you are putting money into a short-term rental property and watching what comes back each year after every expense is paid.
The formula is simple:
Cash-on-Cash Return = Net Annual Cash Flow / Total Cash Invested
Net annual cash flow is what is left after you pay every single expense: your mortgage, property taxes, insurance, property management fees, platform fees, utilities, maintenance, and cleaning costs. Total cash invested is the money you actually wrote checks for at closing and setup, including your down payment, closing costs, and the furniture and furnishings to make the property rentable.
The reason investors fixate on CoC rather than cap rate or gross yield is that CoC accounts for your financing. A property with a 10% cap rate can still produce a negative cash-on-cash return if the debt service on a 7% DSCR loan consumes more than the net operating income. Understanding that distinction is what separates investors who run the actual numbers from investors who buy on optimistic revenue projections.
The Step-by-Step Calculation: Two Real Markets
Let me work through the math on two properties that show up frequently in investor conversations: a $350,000 cabin in Gatlinburg TN and a $600,000 beach house in Destin FL. Both markets have strong occupancy. Both show up in StaySTRA data as high-demand destinations. What separates them is the cost structure once you get past gross revenue.
For both examples I am using DSCR loan terms at 7% interest with 25% down on a 30-year amortization. That is the financing structure most STR investors without qualifying W-2 income will be using in 2026. At 7% and 25% down, the annual debt service factor is approximately 7.98% of the loan amount per year.
Example A: Gatlinburg TN Cabin, $350,000 Purchase Price
StaySTRA data for Gatlinburg cabins in the $300,000 to $500,000 range shows average gross annual revenue of $42,965, with top-quartile performers running closer to $55,000 to $60,000. A quality 2 to 3 bedroom cabin with a hot tub at 75% occupancy and a $210 average daily rate generates approximately $57,500 in gross annual income. That is the revenue side.
| Line Item | Annual Amount |
|---|---|
| Gross Annual Revenue | $57,500 |
| Property Management (25%) | ($14,375) |
| Platform Fees (3%) | ($1,725) |
| Utilities | ($3,600) |
| Maintenance and Repairs | ($2,875) |
| Insurance | ($1,200) |
| Property Taxes (TN, est. 0.7%) | ($2,450) |
| Net Operating Income | $31,275 |
| DSCR Loan Debt Service (7%, $262,500 loan) | ($20,964) |
| Net Annual Cash Flow | $10,311 |
Cash invested: $87,500 (25% down) + $10,500 (3% closing costs) + $12,000 (furnishings) = $110,000
Cash-on-Cash Return: 9.4%
Example B: Destin FL Beach House, $600,000 Purchase Price
Destin is one of the stronger STR revenue markets in the country. StaySTRA data shows Destin properties averaging $67,145 in gross annual revenue across all property sizes. A $600,000 beach house at 65% occupancy and a $350 average daily rate produces approximately $83,000 in gross income. Good revenue. The problem is what it costs to hold the property.
| Line Item | Annual Amount |
|---|---|
| Gross Annual Revenue | $83,000 |
| Property Management (25%) | ($20,750) |
| Platform Fees (3%) | ($2,490) |
| Utilities | ($4,800) |
| Maintenance and Repairs | ($4,150) |
| Insurance (FL coastal) | ($10,000) |
| Property Taxes (FL, est. 1.5%) | ($9,000) |
| Net Operating Income | $31,810 |
| DSCR Loan Debt Service (7%, $450,000 loan) | ($35,928) |
| Net Annual Cash Flow | ($4,118) |
Cash invested: $150,000 (25% down) + $18,000 (closing costs) + $15,000 (furnishings) = $183,000
Cash-on-Cash Return: -2.2%
The Gatlinburg cabin returns 9.4%. The Destin beach house loses money every year on a cash basis. Both properties generate strong gross income. The $8,800 insurance difference and the $6,550 property tax difference swing the outcome from positive to negative before you even get to debt service comparisons.
Stay with me here, because this is the insight that most STR revenue calculators skip. The gross revenue numbers between mountain and coastal markets look similar on a spreadsheet. The net numbers look nothing alike once you add the full carrying cost stack.
Sponsored — Beeline
Finance Your Next STR With a DSCR Loan
Qualify on property cash flow, not W-2 income. Beeline specializes in fast DSCR closings for STR investors. No personal income verification required.
Check Your DSCR Eligibility →Affiliate disclosure: StaySTRA may earn a referral fee.
StaySTRA Gross Revenue by Market Type: 2026 Data
Forty years of watching data has taught me this: the most dangerous number in any investment analysis is the one that looks impressive but tells only half the story. I have a piece of Acoma pottery on my desk here in Santa Fe that a friend gave me with the inscription “count what counts.” Gross revenue by market type is a perfect example of what that means. It counts. Just not by itself.
Across the StaySTRA database of active STR markets, average gross annual revenue by market category breaks down as follows for 2026:
| Market Type | Avg Gross Annual Revenue | Sample Markets | Avg Property Price |
|---|---|---|---|
| Lake | $62,782 | Traverse City MI, Door County WI | $676,271 |
| Inland/Cabin | $57,732 | Broken Bow OK, Branson MO | $754,648 |
| Mountain | $54,383 | Gatlinburg TN, Blue Ridge GA, Sedona AZ | $744,192 |
| Beach | $52,006 | Destin FL, Myrtle Beach SC, Panama City Beach FL | $653,590 |
| Urban | $50,006 | Nashville TN, Austin TX, Scottsdale AZ | $777,849 |
A few things worth noting before you draw conclusions from this table. These averages span all property sizes in each market, including large multi-bedroom cabins that pull the category mean higher than a typical single-property purchase. Urban markets show the lowest gross revenue but often the most consistent year-round occupancy, which changes the risk profile compared to seasonal beach or lake markets. The inland/cabin category includes destination markets like Broken Bow OK that behave more like mountain resort communities than suburban investment neighborhoods.
Gross revenue is the input. Cash-on-cash return is the output. What happens in between is where market type actually matters.
The Full Cost Stack: What Actually Determines CoC
Think of the STR cost stack the way a small business owner thinks about their P&L: revenue is the headline, but the expenses between revenue and profit are where the real story lives. Here is the breakdown for a typical STR investor using professional management and a DSCR loan in 2026.
Operating Expenses (as a percentage of gross revenue):
- Property management fees: 20 to 25 percent of gross revenue
- OTA platform fees (Airbnb/VRBO): 3 percent
- Utilities (electric, water, internet, streaming): 5 to 8 percent
- Maintenance, repairs, and supplies: 5 percent
That puts total operating expenses, before insurance, property taxes, and debt service, at roughly 33 to 41 percent of gross revenue. A clean way to model it is 37 to 40 percent for the operating expense ratio, then add insurance and property taxes as fixed line items on top.
The fixed costs vary enormously by market. This is where the CoC math gets decided.
| Market / State | Typical Annual STR Insurance | Estimated Property Tax Rate |
|---|---|---|
| Tennessee (mountain cabin) | $1,100 to $2,500 | 0.6 to 0.9% |
| Georgia (mountain cabin) | $1,500 to $3,000 | 0.8 to 1.1% |
| South Carolina (beach) | $3,000 to $5,500 | 0.9 to 1.1% |
| Florida (coastal) | $7,000 to $14,000 | 1.2 to 1.8% |
| Texas (Gulf Coast) | $6,000 to $12,000 | 1.8 to 2.4% |
| Colorado (ski resort) | $5,000 to $9,000 | 0.5 to 0.7% |
| Utah (ski resort) | $5,000 to $8,000 | 0.5 to 0.6% |
Do not let that Florida insurance range scare you away from coastal investing entirely. But do let it anchor your underwriting. An $8,800 difference in annual insurance costs is not a rounding error. At 8% gross yield, $8,800 in extra annual cost is the equivalent of a $110,000 more expensive property, which is the difference between a deal that works and one that does not at current price levels.
Sponsored — Beeline
Finance Your Next STR With a DSCR Loan
Qualify on property cash flow, not W-2 income. Beeline specializes in fast DSCR closings for STR investors. No personal income verification required.
Check Your DSCR Eligibility →Affiliate disclosure: StaySTRA may earn a referral fee.
Net Cash-on-Cash Returns by Market Type: The Honest Table
The table below shows what cash-on-cash return looks like across five market categories using DSCR financing at 7% with 25% down and professional property management. These are modeled on typical properties in each category, not the top performers. Property prices and revenue figures are drawn from StaySTRA database averages for each market type.
| Market Type | Example Property | Purchase Price | Gross Revenue | Insurance | Net Cash Flow | Cash Invested | CoC Return |
|---|---|---|---|---|---|---|---|
| Mountain (TN) | Gatlinburg cabin | $350,000 | $57,500 | $1,200 | $10,315 | $110,000 | 9.4% |
| Inland Cabin (OK) | Broken Bow cabin | $400,000 | $55,000 | $1,800 | $4,696 | $124,000 | 3.8% |
| SC Beach | Myrtle Beach house | $400,000 | $49,000 | $4,200 | ($854) | $124,000 | -0.7% |
| FL Beach (coastal) | Destin FL house | $600,000 | $83,000 | $10,000 | ($4,118) | $183,000 | -2.2% |
| Premium Ski | Park City UT | $1,100,000 | $46,000 | $6,500 | ($52,605) | $320,000 | -16.4% |
The mountain cabin at $350,000 clears 9 percent. Everything else in this table either barely breaks even or loses money on a cash basis. That is not a coincidence. The Tennessee cabin benefits from low insurance, low property taxes, and an entry price that keeps debt service manageable relative to revenue. Every other category fails on at least one of those three dimensions.
A note on the Park City UT figure: StaySTRA data shows Park City properties averaging $45,788 in annual gross revenue against a market average purchase price of $1,108,871. These are all-size market averages. At those numbers, the property cannot generate enough income to service the debt at 7% regardless of insurance or tax efficiency. The yield on invested capital is simply too thin at $1 million entry prices generating $46,000 in gross revenue.
What a Good Cash-on-Cash Return Looks Like for an STR
My benchmark, developed across four decades of watching real estate markets from government statistical analysis to private research, goes like this:
- 8% or above: Strong performance. Your property covers all costs including debt, generates real annual cash income, and builds equity through amortization. You have room for a bad season without going underwater.
- 5% to 7.9%: Acceptable in a high-appreciation market where price growth justifies holding a lower-yielding asset. Not a cash flow investment in the traditional sense.
- Below 5%: You are betting on appreciation and hoping revenue improves. This is not a cash flow strategy. It is a speculative one.
- Negative: You are subsidizing the property out of pocket each year. This can work as a lifestyle asset with partial rental offset, but it is not an investment by any traditional cash flow definition.
The 8% threshold is not arbitrary. At 8% CoC on a $110,000 cash investment, you clear $8,800 per year in pure cash income. A 30-year DSCR mortgage also pays down principal by roughly 1.5 to 2 percent of the loan balance in the early years. An 8% CoC investment with normal market appreciation produces total annual returns in the 12 to 16 percent range once you include equity buildup.
Which Markets Consistently Hit 8 Percent or Better
Based on StaySTRA data and the cost analysis above, the market types with the best probability of reaching 8% CoC with DSCR financing and professional management in 2026:
Tennessee mountain cabin markets. Gatlinburg, Pigeon Forge, and Sevierville have entry points between $300,000 and $600,000 for quality 2 to 4 bedroom cabins with hot tubs, which is what the guest market consistently demands. Insurance averages $1,100 to $2,500. Tennessee property taxes are among the lowest in the country at 0.6 to 0.9 percent of assessed value. A quality cabin at $350,000 generating $55,000 to $60,000 in gross annual revenue, achievable at 72 to 78 percent occupancy with good amenities, produces 8 to 10 percent CoC at DSCR terms.
North Georgia mountain cabin markets. Blue Ridge and Ellijay offer similar economics to the Tennessee Smokies at comparable or slightly lower entry prices. The guest profile is weekend Atlanta escapes, which drives consistent demand without the extreme seasonality of ski markets. Insurance is similar to Tennessee.
I want to be honest about what is missing from the 8 percent club in 2026: most beach markets at typical entry prices, most urban markets at current valuations, and essentially all premium ski resort markets. The revenue is there in many of those places. The carrying costs are not investor-friendly at 7 percent debt service rates.
Which Markets Fail to Pencil
Galveston TX is the clearest example in StaySTRA data. Average gross annual revenue across Galveston STRs is $43,276, reasonable for a Gulf Coast market. But Galveston properties average $618,727 in purchase price, hurricane and flood insurance runs $6,000 to $12,000 per year, and Texas has some of the highest property tax rates in the country at 1.8 to 2.4 percent of assessed value. StaySTRA data shows only 2.4 percent average CoC at conventional financing terms. At 7% DSCR with professional management, Galveston goes negative for most investors.
Premium Colorado ski markets, including Vail, Breckenridge above $800,000, Aspen, and Telluride, are another category that looks exciting until you run the numbers. StaySTRA data shows Vail CO properties averaging a negative 2.9 percent CoC even at conventional 6% loan rates with self-management. At 7% DSCR with professional management, the picture worsens significantly. The revenue in those markets ($47,000 to $55,000 average gross) cannot service debt on $1 million to $2 million properties. The guests who pay $400 a night in Vail are not generating enough total annual nights to make the arithmetic work.
Sponsored — Beeline
Finance Your Next STR With a DSCR Loan
Qualify on property cash flow, not W-2 income. Beeline specializes in fast DSCR closings for STR investors. No personal income verification required.
Check Your DSCR Eligibility →Affiliate disclosure: StaySTRA may earn a referral fee.
The Insurance Factor: Why the Gap Is Bigger Than It Looks
Here is the number that should anchor your underwriting: an $8,800 difference in annual insurance costs, the gap between $1,200 in Tennessee and $10,000 in coastal Florida, is equivalent to owning a $110,000 more expensive property at 8 percent gross yield. That is the entire equity difference on a 25 percent down payment for a $350,000 cabin versus a $440,000 cabin. One transaction pencils and one does not, and insurance is what divides them.
STR investors shopping coastal Florida have three real options. First, buy at a price that accounts for the insurance cost, meaning finding the property significantly below market or identifying an unusual revenue opportunity at higher ADR. Second, shift to states with lower coastal insurance costs, South Carolina, North Carolina, and parts of coastal Georgia, where beach STR markets can also produce real returns. Third, accept that coastal beach properties at current Florida prices are lifestyle assets with partial cost offset, not pure cash flow investments.
Mountain and inland cabin markets do not face this constraint. A Tennessee cabin bought at fair market value with typical revenue for the area will pencil at DSCR terms because the fixed cost structure is investor-friendly. The revenue per dollar of property value is similar to coastal markets in many cases. The carrying cost per dollar of property value is dramatically lower.
Current occupancy and revenue benchmarks for both markets discussed here are available on StaySTRA. The Gatlinburg, TN market page and Destin, FL market page show current average daily rates, occupancy trends, and revenue distributions for active listings. Run those numbers before you close.
For a broader look at how market types compare on total returns including appreciation, see our analysis of beach vs. mountain vs. lake STR market returns in 2026. For how to think about ROI benchmarks more broadly, our piece on what a good ROI looks like for an Airbnb property covers the full range of return metrics investors use. If you are working through DSCR financing, our article on how to get a DSCR loan for an Airbnb property breaks down exactly what lenders look at in 2026. And for the complete cash flow calculation method, how to calculate Airbnb cash flow before you buy walks through each step.
Frequently Asked Questions
What is a good cash-on-cash return for a short-term rental?
Eight percent or above is the threshold most experienced STR investors use as the bar for a strong cash flow investment at 2026 financing rates. Returns in the 5 to 7.9 percent range are acceptable in markets with strong appreciation potential. Below 5 percent is speculative rather than cash flow driven. At a 7% DSCR loan, you need stronger revenue relative to purchase price than you would at a 5% conventional rate, so the effective bar moves higher as borrowing costs rise.
How do I calculate cash-on-cash return for an Airbnb property?
The formula is Net Annual Cash Flow divided by Total Cash Invested. Net cash flow is gross revenue minus all operating expenses (management fees, platform fees, utilities, maintenance, cleaning), minus insurance, minus property taxes, minus your annual mortgage payment. Total cash invested is your down payment plus closing costs plus money spent furnishing the property before your first guest. If your net cash flow is $9,000 and you invested $110,000 at closing, your CoC return is 8.2 percent.
Why do coastal Florida STR markets often produce lower cash-on-cash returns than mountain markets?
Two factors work against coastal Florida: insurance and property taxes. Annual STR insurance in coastal Florida runs $7,000 to $14,000 because of hurricane and flood risk exposure. Property taxes average 1.2 to 1.8 percent of assessed value. Together, these fixed costs consume $16,000 to $23,000 per year before you make your first mortgage payment. Mountain cabin markets in Tennessee or North Georgia carry $1,200 to $2,500 in insurance and 0.6 to 0.9 percent property taxes (fixed costs that are $12,000 to $18,000 lower per year). The revenue difference between market types is not large enough to overcome that gap at typical price points and DSCR financing rates.
Can short-term rentals deliver 8 percent cash-on-cash returns with a DSCR loan at 7 percent?
Yes, but market selection and price point matter significantly. Mountain cabin markets in Tennessee and North Georgia at purchase prices under $450,000 can consistently produce 8 to 10 percent CoC at 7% DSCR rates when the property generates $50,000 to $65,000 in gross annual revenue, achievable with quality amenities and active revenue management. Urban markets, coastal Florida, and premium ski resort markets face structural challenges at 7% DSCR rates because the price-to-revenue ratio is too thin once you account for the full carrying cost stack.
What is the difference between cash-on-cash return and cap rate for a short-term rental?
Cap rate measures net operating income divided by the purchase price and it ignores financing entirely. It answers the question of how well the property performs as an asset regardless of how it is bought. Cash-on-cash return adds the financing layer. It measures how much cash you actually receive relative to the cash you put in. Two properties with the same cap rate can have very different CoC returns depending on whether you pay cash, use conventional financing at 6%, or use a DSCR loan at 7%. For leveraged investors comparing financed purchases, CoC is the more useful number.
We do our best to keep our data accurate and up to date, but markets move fast and we are only human. Always verify current figures directly with local sources before making investment decisions.
Sponsored — Beeline
Finance Your Next STR With a DSCR Loan
Qualify on property cash flow, not W-2 income. Beeline specializes in fast DSCR closings for STR investors. No personal income verification required.
Check Your DSCR Eligibility →Affiliate disclosure: StaySTRA may earn a referral fee.
The StaySTRA Analyzer runs the full cash-on-cash calculation on any address you input, pulling live revenue projections and layering in financing assumptions at current market rates. If you are evaluating a specific property, run the address before you make an offer.
Run your property analysis at the StaySTRA Analyzer.
Become a StaySTRA Insider
Join free — get our newsletter + 1 free property analysis/month.
No spam. Unsubscribe anytime. Free membership includes property analyses and market insights.



