

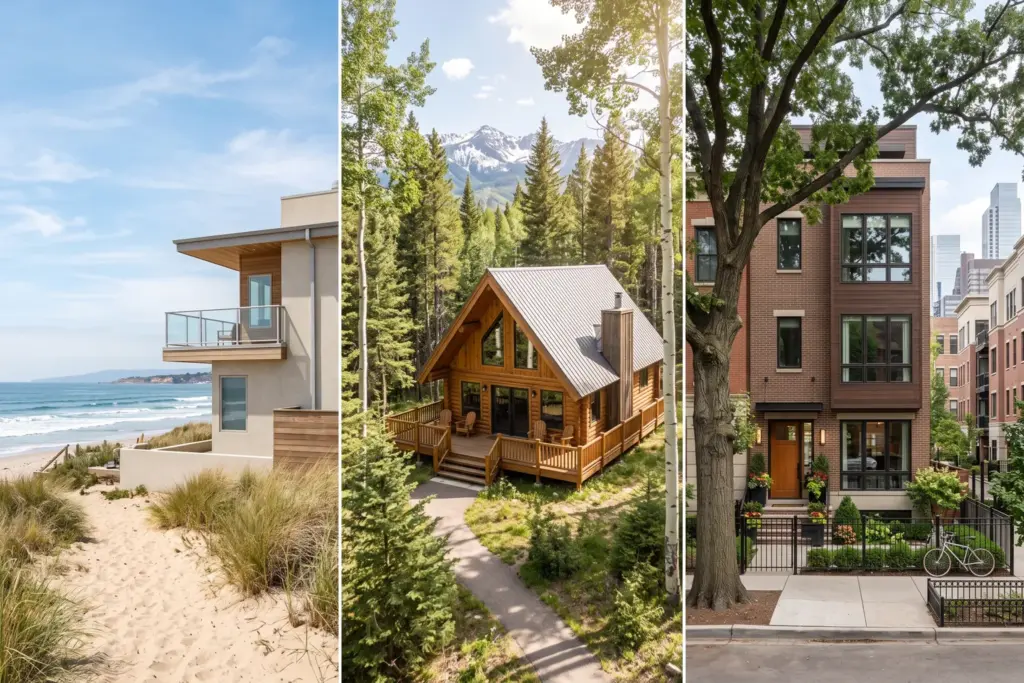
Key Takeaways
- A short-term rental in a strong market produces a cap rate of 7 to 9 percent after operating expenses, roughly double the 4 to 6 percent benchmark for long-term rentals.
- Mountain cabin markets like Gatlinburg deliver the best risk-adjusted returns in StaySTRA data, with cap rates near 8 percent on properties that carry lower price tags than coastal or lake markets.
- Cash-on-cash return at 20 percent down ranges from negative (urban Nashville, -2.9%) to solid (Gatlinburg, 7.6%), which means the market you pick matters as much as the deal you negotiate.
- Once you add a professional property manager at 20 to 25 percent of gross revenue, many markets that look strong on paper drop below 5 percent cap rate and turn cash-flow negative.
- A cap rate above 7 percent and cash-on-cash above 6 percent at 20 percent down is a reasonable benchmark for a solid STR investment in 2026.
A 2-bedroom cabin in Gatlinburg, Tennessee produced $59,652 in gross annual revenue last year based on StaySTRA market data. After subtracting every real operating cost, it delivered an 8.1 percent cap rate. Forty years as a government statistician taught me to start with that number before any other, because gross revenue is what gets promoted in Airbnb success stories, and net operating income is what actually pays your mortgage.
Most content about Airbnb ROI stops at the first figure. This article starts at the second.
Think of it the way you would a vending machine. The machine takes in $10,000 a month in quarters, but that does not mean you keep $10,000. After restocking, repairs, rent on the location, and the cut the building owner takes, what actually lands in your account is a very different number. Short-term rental investing works the same way. Gross revenue is the quarters going in. Net income is what lands in your pocket. The gap between the two is where most investors get surprised.
This guide walks through exactly what that gap looks like across four market types, what your real return should be before you write an offer, and what a good ROI actually means in 2026 across different investor scenarios.
Why Gross Revenue Is Not Your ROI
When someone tells you their Airbnb “makes $80,000 a year,” they almost certainly mean gross revenue, which is the total amount guests paid before any expenses came out. That number does not tell you whether the property is a good investment. It tells you whether it is a popular listing.
The journey from gross revenue to what you actually earn runs through multiple cost categories, and each one is real. Platform fees come off the top. Property taxes, insurance, and maintenance are recurring every year regardless of occupancy. Cleaning costs scale with how many guests you host. Utilities run whether the property sits empty or full. And if you hire a property manager, another 20 to 25 percent of gross revenue leaves before you see a dollar.
I have seen investors run pre-purchase models that include only the mortgage payment against Airbnb gross revenue and call the difference “profit.” That is not profit. That is an optimistic spreadsheet that has not yet met a cleaning invoice or a $2,000 HVAC repair. Our full breakdown of what the numbers actually look like in 2026 covers this in more depth, but the short version is: expenses typically consume 35 to 55 percent of gross revenue before financing costs.
The right starting point is not “how much does this property earn?” It is “how much does this property earn after everything it costs to operate it?”
The Four Return Metrics That Actually Matter
There are four numbers worth calculating before you make an offer on a short-term rental. Each one tells you something different about whether the deal makes sense.
Gross Rental Multiplier (GRM) is the simplest screen. Divide the purchase price by annual gross revenue. A $400,000 property earning $50,000 gross has a GRM of 8. Lower is better. For STRs, a GRM below 10 is worth exploring further. Above 14, and the numbers usually struggle to work at current interest rates.
Gross Yield flips the GRM and expresses it as a percentage. Annual gross revenue divided by purchase price. That $400,000 property at $50,000 gross earns a 12.5 percent gross yield. This number looks impressive until you subtract expenses and discover that 12.5 percent gross often becomes 6 to 7 percent net. Use gross yield as an entry filter, not a final answer.
Cap Rate is where the real analysis begins. Cap rate is net operating income (after all operating expenses, before debt service) divided by property value. It measures what the property earns regardless of how you finance it. This lets you compare markets and properties on equal footing. Long-term rental properties typically trade at 4 to 6 percent cap rates. A short-term rental should clear that hurdle meaningfully or you are not being compensated for the additional operational complexity.
Cash-on-Cash Return (CoC) measures what the property earns on the actual cash you invested, accounting for your mortgage payment. Divide annual cash flow (NOI minus annual mortgage P&I) by your total cash invested (down payment plus closing costs). Cash-on-cash below 4 percent at 20 percent down means the mortgage payment is consuming most of the property’s income. Cash-on-cash above 8 percent at 20 percent down is strong for a 2026 STR market.
What Actually Comes Out of Your Gross Revenue
The table below is not a worst-case scenario. These are standard operating costs for a professionally run short-term rental. Don’t let any single line item surprise you: the whole stack is what matters.
| Cost Category | Typical Annual Amount | Notes |
|---|---|---|
| Platform fee (Airbnb host) | 3% of gross revenue | Standard split-fee model for individual hosts |
| Property tax | 1.0% to 1.4% of property value | Varies widely by state and county |
| Insurance | $1,800 to $3,000 | Higher in coastal and wildfire zones |
| Maintenance and repairs | 1.0% of property value | Budget more for cabins and older properties |
| Cleaning service | $70 to $120 per turn | Scales with occupancy and average stay length |
| Utilities | $1,800 to $3,000 | $150 to $250 per month depending on property size |
| HOA fees (where applicable) | $2,400 to $7,200 | Common in urban condos and resort communities |
| Property management (if used) | 20% to 25% of gross revenue | Up to 30% to 40% in resort markets with add-on fees |
A self-managed property with no HOA typically sees 35 to 45 percent of gross revenue consumed by operating costs before debt service. A professionally managed property can see 55 to 65 percent consumed, which changes the cap rate threshold you need before the math works.
Cleaning is the line item I see underestimated most often. At 65 percent occupancy with an average 3.4-night stay on a 2-bedroom property, you are looking at roughly 70 turns per year. At $90 per turn, that is $6,300 annually. It is a real number, not a footnote.
What StaySTRA Data Shows by Market Type
The table below uses 12-month average data (July 2024 through June 2025) from the StaySTRA database for four representative markets, one from each major STR category. All figures are for a representative 2-bedroom property at typical market valuations. Expense assumptions are consistent across markets: 1.2 percent property tax (1.1 percent for California), 3 percent platform fee, insurance based on market type and geographic risk, 1 percent annual maintenance, cleaning at $80 per turn, and $2,400 annual utilities.
| Market | Type | Property Value | Gross Revenue | Operating Costs | Net NOI | Cap Rate |
|---|---|---|---|---|---|---|
| Panama City Beach, FL | Beach | $380,000 | $45,744 | $17,852 | $27,892 | 7.3% |
| Gatlinburg, TN | Mountain | $480,000 | $59,652 | $20,910 | $38,742 | 8.1% |
| Nashville, TN | Urban | $480,000 | $52,848 | $24,145 | $28,703 | 6.0% |
| South Lake Tahoe, CA | Lake | $700,000 | $70,896 | $25,307 | $45,589 | 6.5% |
Several things stand out in this data that are worth naming directly.
Mountain markets are delivering the best ratio of cap rate to entry price. Gatlinburg’s 8.1 percent cap rate on a $480,000 property reflects real year-round demand across multiple travel motivations: fall foliage, winter cabin getaways, spring hiking, summer family trips. At 48.6 percent average annual occupancy and a $334 average daily rate, the revenue base is solid without requiring peak-season heroics. This consistency is what drives a better risk-adjusted return than markets that look flashier at their peak.
Urban markets show the tightest margins despite strong demand. Nashville’s 6.0 percent cap rate is respectable against long-term rental benchmarks, but urban STRs carry costs that beach and mountain properties often do not, including HOA fees on condos, higher property values per unit of income, and a competitive listing environment that requires more active management to maintain occupancy. Nashville has not stopped working as an STR market. It requires more precision on the buy side than it did four years ago.
Lake markets generate the highest gross revenue in this data set ($70,896 annually for South Lake Tahoe) but the $700,000 entry price compresses cap rate to 6.5 percent. The elevated California insurance premiums and higher property taxes further thin the margin. South Lake Tahoe also carries meaningful regulatory risk from permit restrictions across both Placer and El Dorado counties. Our market-type comparison from July 2026 covers these regulatory dynamics in detail.
Beach markets sit in the middle of the cap rate range, but seasonality is the variable the average figure does not capture. Panama City Beach’s 40.8 percent annual occupancy average conceals peak summer occupancy that can hit 85 to 90 percent and winter shoulder occupancy that can drop below 20 percent. A cash flow model that annualizes summer rates will not match what the bank account shows in February.
For a more detailed look at gross revenue patterns across markets before we get to expenses, our income data by market shows ADR and occupancy by location.
Sponsored — Beeline
Finance Your Next STR With a DSCR Loan
Qualify on property cash flow, not W-2 income. Beeline specializes in fast DSCR closings for STR investors. No personal income verification required.
Check Your DSCR Eligibility →Affiliate disclosure: StaySTRA may earn a referral fee.
What Down Payment Level Does to Your Real Return
Cap rate measures what the property earns regardless of financing. Cash-on-cash is what you earn on the actual dollars you deployed, accounting for your mortgage payment. The two numbers diverge based on how much you borrow and at what rate.
The table below uses the Gatlinburg example (NOI $38,742, property value $480,000) at a 7.25 percent 30-year fixed rate, which represents a reasonable DSCR loan rate for an STR investment property in mid-2026. Investment property loan minimums vary: conventional loans typically require 20 to 25 percent down, while DSCR programs may allow 15 percent or, in some specialized programs, 10 percent at higher rate premiums.
| Down Payment | Cash Invested | Loan Amount | Annual P&I | Annual Cash Flow | Cash-on-Cash Return |
|---|---|---|---|---|---|
| 10% | $48,000 | $432,000 | $35,381 | $3,361 | 7.0% |
| 20% | $96,000 | $384,000 | $31,452 | $7,290 | 7.6% |
| 25% | $120,000 | $360,000 | $29,484 | $9,258 | 7.7% |
The modest difference in cash-on-cash between 10 percent and 25 percent down reflects an important reality: Gatlinburg’s cap rate of 8.1 percent barely exceeds the mortgage rate of 7.25 percent. The spread is only about 0.85 percentage points, which means leverage is doing relatively little additional work for you. Putting more down improves cash flow in absolute terms and reduces interest costs, but you also have more capital tied up in the deal.
Now apply the same exercise to Nashville. At a 6.0 percent cap rate against a 7.25 percent mortgage rate, the cap rate is actually below the borrowing cost. This is negative leverage, and it produces negative cash flow at 20 percent down (-$2,746 per year, or -2.9 percent CoC). To reach breakeven in Nashville, a buyer needs roughly 30 percent down, a lower purchase price, or operational improvements that meaningfully lift NOI above the StaySTRA market average.
Urban STR markets are not broken investments. They work as equity-building plays in appreciating cities and as lifestyle properties. But they should not be bought with a cash flow thesis at 7 percent interest rates unless the property significantly outperforms its market average.
Sponsored — Beeline
Finance Your Next STR With a DSCR Loan
Qualify on property cash flow, not W-2 income. Beeline specializes in fast DSCR closings for STR investors. No personal income verification required.
Check Your DSCR Eligibility →Affiliate disclosure: StaySTRA may earn a referral fee.
Red Flags That Compress ROI Below What the Model Shows
The calculations above assume a property performing at StaySTRA’s market average. Several conditions can push actual returns well below a modeled number.
Seasonality concentration. A beach property that earns 70 percent of its annual revenue in a 10-week summer window carries different risk than a mountain property with year-round demand. One bad summer season from a storm, a listing suspension, or a regional event can wipe out the majority of annual income. Model the off-peak months explicitly, not as an annual average.
Supply saturation. Markets where new STR listings have grown faster than visitor demand see downward pressure on both occupancy rates and average daily rates. Some markets that looked strong in 2022 and 2023 are meaningfully softer today. Check the trend direction in a market, not just the current snapshot. A market averaging 50 percent occupancy but trending down from 60 percent is a different investment than one holding steady at 50 percent.
Regulatory exposure. A permit that exists today is not guaranteed to exist in five years. Many lake markets, popular mountain towns, and coastal resort destinations are in permit freeze or active review. A property generating 7 percent cap rate on an active permit can generate 0 percent if that permit is not renewed or is revoked. Verify current permit status, its transferability at sale, and the trajectory of local regulations before closing.
Property management cost compression. Adding a full-service property manager at 25 percent of gross revenue to the Gatlinburg example drops NOI from $38,742 to $23,829 and cap rate from 8.1 percent to 5.0 percent. At 20 percent down, the property turns cash-flow negative. That does not make management wrong for every investor, but it changes the entry price requirements significantly. A managed STR needs either a much lower purchase price or much higher gross revenue to produce the same returns as a self-managed one.
Startup capital underestimation. A photo-ready, fully furnished 2-bedroom short-term rental typically costs $12,000 to $25,000 to set up, depending on market expectations and property condition. That capital is part of your investment in the deal and should factor into your cash-on-cash calculation for year one.
What Is a Good ROI for an Airbnb Property in 2026?
Based on what StaySTRA data actually shows across four market types, here are the benchmarks that hold up.
A cap rate of 7 percent or above for a self-managed property is a solid entry threshold. It clears the long-term rental benchmark by at least 1 percentage point and compensates for the additional operational complexity of running an STR. Markets that deliver 7 to 9 percent cap rates without leaning on exceptional seasonal peaks are the ones worth spending more time on.
A cash-on-cash return of 6 percent or above at 20 percent down is a reasonable threshold for a financed STR at current interest rates. Below 4 percent cash-on-cash, you are relying on appreciation to justify the investment. That is a valid strategy, but it is not an income strategy. Name it correctly so your underwriting matches your actual thesis.
Cap rates above 9 or 10 percent deserve scrutiny rather than celebration. Returns that high in an established market often reflect heavy seasonality risk, a regulatory overhang, or supply dynamics about to move against the market. The most consistent STR performers I see in the data are not the flashiest gross earners. They are properties with year-round demand, reasonable operating costs, and a regulatory environment that is stable or improving.
Mountain cabin markets continue to stand out on risk-adjusted terms for 2026. Beach markets can work with careful seasonality modeling. Urban markets require patience on the buy side or a clear appreciation thesis. Our market rankings for 2026 break down the best-performing markets across all four categories with the underlying data.
Sponsored — Beeline
Finance Your Next STR With a DSCR Loan
Qualify on property cash flow, not W-2 income. Beeline specializes in fast DSCR closings for STR investors. No personal income verification required.
Check Your DSCR Eligibility →Affiliate disclosure: StaySTRA may earn a referral fee.
Frequently Asked Questions
What is a realistic cap rate for an Airbnb property in 2026?
Based on StaySTRA data, well-performing STR markets deliver cap rates of 7 to 9 percent for a self-managed property. Mountain cabin markets like Gatlinburg average around 8 percent. Urban markets like Nashville land closer to 6 percent. Lake markets with high entry prices like South Lake Tahoe typically produce 6.5 percent. Cap rates above 9 percent in a well-established market often indicate heavy seasonality or regulatory uncertainty that compresses actual returns below the paper figure.
Is a 10 percent ROI realistic for an Airbnb property?
A 10 percent cash-on-cash return at 20 percent down is achievable but uncommon at 2026 interest rates and property values. It typically requires a mountain cabin or rural market where purchase prices are below $400,000, gross revenue exceeds $50,000, and the property is self-managed. High-demand beach markets can approach 10 percent in strong peak years, but the seasonal variance makes that figure unreliable as an annual expectation. Model conservatively and treat 10 percent as an aspirational result, not a baseline projection.
How does Airbnb ROI compare to long-term rental ROI?
Long-term rental cap rates in most U.S. markets run 4 to 6 percent. Short-term rentals in the same markets often produce 6 to 9 percent cap rates, a meaningful premium. That premium compensates for higher operational intensity, greater seasonality risk, and more regulatory uncertainty. Whether the premium justifies the complexity depends on your management capacity, risk tolerance, and the specific market. Some investors who have tried both find that a professionally managed STR in a strong market outperforms their long-term rental on cap rate but not on hassle-adjusted terms.
What is a good cash-on-cash return for a financed Airbnb in 2026?
At a 7.25 percent 30-year rate and 20 percent down, a cash-on-cash return of 6 percent or above is a solid result for a self-managed STR. Returns in the 7 to 9 percent range indicate the market is working well at current financing costs. Below 4 percent, the property is not generating meaningful current income and you are relying primarily on appreciation. Always include closing costs in your cash invested figure when calculating cash-on-cash, not just the down payment.
Does hiring a property manager significantly reduce Airbnb ROI?
Yes. A property manager at 25 percent of gross revenue is a major cost. Using the Gatlinburg example: a property that produces an 8.1 percent cap rate self-managed drops to roughly 5.0 percent with full-service management, and turns cash-flow negative at 20 percent down. That does not make management wrong for every investor. It means your gross revenue target needs to be higher, your purchase price needs to be lower, or you need to accept that the investment is an equity-building play rather than a cash-flow generator in early years.
Which market type delivers the best Airbnb ROI in 2026?
Based on StaySTRA data for July 2024 through June 2025, mountain cabin markets deliver the best risk-adjusted returns, combining cap rates in the 7 to 9 percent range with year-round demand and mid-range entry prices. Beach markets deliver high peak revenue but require careful seasonality modeling. Lake markets generate strong gross revenue but are compressed by high entry prices and growing regulatory exposure. Urban markets offer steady demand and appreciation potential but carry the tightest cap rates at current price levels.
We do our best to keep our data accurate and up to date, but markets move fast and we are only human. Always verify current figures directly with local sources before making investment decisions.
The StaySTRA Analyzer pulls current ADR and occupancy data and lets you model your specific market before you make an offer. That is the step that turns a general framework into a property-specific answer. Run your market through the Analyzer here.
Become a StaySTRA Insider
Join free — get our newsletter + 1 free property analysis/month.
No spam. Unsubscribe anytime. Free membership includes property analyses and market insights.



