Key Takeaways
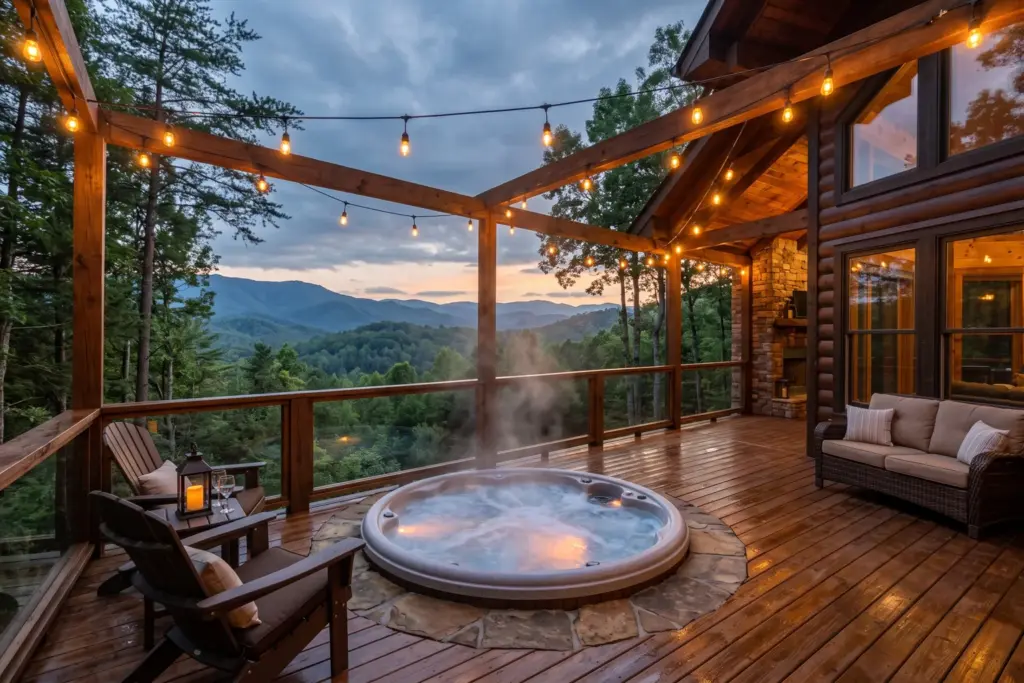
- Hot tubs generate the highest consistent ROI in mountain and cabin markets, with Gatlinburg properties commanding up to 74% higher nightly rates than comparable listings without them.
- Pool ROI depends almost entirely on market type: 83% ADR premium in Scottsdale, much lower in beach markets where pools are already standard.
- Dedicated workspaces with fast WiFi correlate with 14% higher host earnings and measurably higher mid-week occupancy, making them the best cost-per-dollar upgrade in urban and suburban markets.
- Table stakes amenities (WiFi, AC, cable TV, parking) produce zero measurable ADR premium, yet hosts routinely overspend on upgrading them.
- StaySTRA data shows luxury-tier properties in Gatlinburg averaged $612 ADR in June 2026, a 55% premium over the $394 market baseline, reflecting what happens when hosts stack multiple high-return amenities in a market that rewards them.
Properties with hot tubs in Gatlinburg earn 74% higher nightly rates than comparable listings without them. That is not from 2022, when everything was running hot. That is 2026 data on active listings in one of the most competitive cabin markets in the country.
I have tracked amenity impact data obsessively for two years. The conclusion is always the same: market type determines amenity value far more than the amenity itself. Hosts who understand this framework make smart upgrade decisions. Hosts who do not spend thousands on the wrong things and wonder why their ADR did not move.
Here is what the data actually shows for 2026.
Why Market Type Is the Variable That Changes Everything
Amenities create pricing power when guests cannot easily find them elsewhere. That is the whole framework. When an amenity is scarce relative to demand, it differentiates. When it is standard, it becomes expected.
Three buckets matter most:
- Mountain and cabin markets (Gatlinburg, Blue Ridge, Big Bear, Smoky Mountains): Hot tubs and fire pits deliver massive premiums. Guests are booking an experience, not just a place to sleep. The amenity is part of why they chose the trip.
- Desert and suburban markets (Scottsdale, Phoenix, Las Vegas): Pools command enormous premiums because outdoor recreation is the draw and private pools are genuinely scarce relative to demand.
- Beach markets (Outer Banks, Gulf Shores, Destin): Pools and hot tubs still add value, but the premium is lower because the water is already the amenity. Outdoor spaces, fire pits, and proximity to the beach matter more than water features.
StaySTRA data from June 2026 confirms this at the market level. Luxury-tier properties in Gatlinburg averaged $612 in ADR, a 55% premium over the $394 market baseline. Nashville luxury properties averaged $597, an 82% premium over the $328 market average. These numbers reflect the compounded effect of stacking multiple high-return amenities in markets where they move the needle. The Gatlinburg STR market data shows the full premium structure available to hosts who invest strategically.
Identify your market bucket before spending anything. The ROI math starts there.
Tier 1: High-ROI Amenities
Hot Tub
Hot tubs are the highest-return single amenity investment in mountain and cabin markets.
The national average ADR premium for hot tub properties is 14.3%, but that number blurs the real picture. In Gatlinburg, properties with hot tubs command 74% higher ADR than comparable properties without them. In the Outer Banks, 78% higher. In Nashville, 57% higher. Even in Scottsdale, hot tub properties earn 41% more per night than comparable listings.
The cost to install runs $5,500 to $13,300 all-in for a mid-range to upper-mid-range unit, including the concrete pad, electrical work, and delivery. Monthly operating costs run $120 to $310, covering electricity, chemicals, and routine maintenance.
A simple example: a 3-bedroom cabin in a mountain market earns $280 per night at 65% occupancy, about 172 nights per year. A conservative 18% ADR premium brings that to $330 per night. Revenue jumps from $48,160 to $56,760. Against a $9,000 upfront cost and $1,800 per year in operating costs, that is roughly a 14-month payback and about $6,800 in net annual gain ongoing. Mountain market hot tubs pay back faster than almost any other property investment.
In beach markets, model the 14% national average, not the mountain premiums. The numbers often still work, but the payback timeline stretches.
Pool
Pools produce the highest single-amenity ADR premiums in desert markets. In Scottsdale, pool properties average 83% higher ADR and 94% higher annual revenue than comparable listings without one. A pool in Scottsdale is effectively a hard filter. Guests who want a pool will not look at non-pool listings.
The ROI calculation is more complex because the capital cost is much higher. An in-ground pool runs $40,000 to $80,000 installed. Add $3,000 to $6,000 per year in maintenance, chemicals, and repairs. That investment makes strong sense in markets where pool vs. no-pool is a binary guest decision, and it becomes harder to justify in markets where pools are already common in the competitive set.
In the Outer Banks, pool properties earn 56% higher ADR. That sounds excellent until you factor in the installation cost and the fact that many competing properties already have pools. Run the math against your specific market before committing capital of this size.
Dedicated Workspace with Fast WiFi
This is the most underrated amenity on this list right now, and it is almost certainly underpriced by the market.
Laptop-friendly workspaces correlate with 14% higher host earnings. More importantly, they fill mid-week gaps that drag down annual occupancy for properties without a clear work signal. Remote work normalization has permanently shifted booking patterns in suburban and urban markets. A three-night mid-week stay from a remote worker is revenue that simply did not exist in 2019.
Setup cost is low. A solid desk, an ergonomic chair, a quality mesh WiFi router, and good natural light runs $800 to $1,500. The return in filled mid-week nights can pay that back in a single month in the right market.
Workspace quality is heading toward being a standard search filter, the same way pet-friendly and pool are filters now. Hosts who build this before competitors do will see the most benefit.
Sponsored — OfferMarket
Buy Your First STR With Long-Term Rental Financing
Flexible, long-term financing for short-term rental buyers. Rates from 5.75%. Instant online quote, no credit pull.
Explore RTL Financing Options →Affiliate disclosure: StaySTRA may earn a referral fee.
Tier 2: Medium-ROI Amenities Worth Evaluating
Pet-Friendly Policy
Roughly 70% of U.S. households own a pet. A large portion of those people struggle to find vacation rentals that welcome their animals. That supply shortage creates pricing power.
Pet-friendly properties average $17 higher per night nationally and generate 24% higher RevPAR than non-pet-friendly listings, driven by both higher ADR and higher occupancy. In Nashville, pet-friendly properties earn a 20% annual revenue premium over comparable non-pet-friendly listings.
The barrier is not revenue, it is operations. A pet policy without a clear deposit structure and a tight inspection protocol will cost more in repairs than it earns in premium. Hosts who get the operations right consistently earn real money from this. Budget $50 to $150 per stay in incremental cleaning costs and build a clear pet fee that covers your exposure. The math almost always works if you price it correctly.
Game Room or Entertainment Space
For group bookings in cabin, lake, and mountain markets, game rooms are one of the strongest conversion tools available. Properties with dedicated entertainment spaces average 15% higher nightly rates and 20% more 5-star reviews than comparable properties without them.
The mechanism is simple: groups book properties where the house itself is the destination. A pool table, shuffleboard table, or arcade machine shifts the booking decision from price-comparison to experience-selection. That is a much better competitive position.
Build-out costs run $5,000 to $15,000 depending on equipment selection. Return is typically faster than a pool and slower than a hot tub. Best ROI comes in markets where the primary guest type is groups booking for weekends, family reunions, or bachelor and bachelorette events.
EV Charger
EV charger searches on vacation rental platforms grew over 80% between 2022 and 2026. That demand is real. The direct ADR impact is real too, just more modest than some of the headline numbers suggest.
The national average ADR lift from EV chargers is 6.8%. Listings with a charger average two additional nights booked per year. Larger market-specific premiums in the research often reflect selection effect: properties that have EV chargers tend to be premium properties with many other high-end amenities. The charger is a signal of overall quality, not the sole driver of the premium.
The honest ROI case: a Level 2 charger costs $600 to $1,500 installed. In markets with tech-forward, affluent guest profiles and limited public charging infrastructure, it pays for itself quickly and shows up in a search filter that is gaining adoption every year. In rural markets with low EV ownership, the return is smaller but still positive. Think of it as a guest experience signal as much as a rate driver.
Tier 3: The Table Stakes Trap
Here is what produces zero measurable ADR premium across every major market study: WiFi, cable TV, air conditioning, heating, and parking.
Not 2%. Not 5%. Zero.
These are baseline expectations. Guests assume your property has them. Meeting that expectation does not raise your rate. Falling short generates bad reviews. There is no upside from upgrading beyond baseline, and there is no ADR lift from spending upgrade budget here.
A $400 smart TV upgrade will not move your nightly rate. A new HVAC system will not move your nightly rate. An $800 cable package upgrade will not move your nightly rate. These are maintenance expenses, not revenue investments.
The real cost is opportunity. Every dollar spent upgrading table stakes is a dollar not going toward a hot tub, a workspace, or a pet-friendly conversion that would actually increase what you charge.
Running the ROI Math Before You Spend
Four inputs determine whether an amenity upgrade makes financial sense:
- Your current ADR and occupancy: What are you earning per night and how many nights per year?
- Expected premium for your market type: Use market-specific estimates, not national averages. A hot tub in a mountain market adds more than twice what it adds in a beach market.
- Total installation cost: All-in, including permits, electrical, construction, and any setup costs.
- Annual operating cost: A hot tub runs $1,440 to $3,720 per year. A pool runs $3,000 to $6,000 per year. Subtract this before calculating net return.
The StaySTRA Analyzer gives you ADR benchmarks for your specific market and property type. Use your actual market data to model the ADR uplift instead of national averages. A conservative estimate built on your real baseline is worth far more than an optimistic estimate built on someone else’s numbers. Connect the amenity ROI to your full cash-on-cash return calculation to see the complete picture of how the upgrade affects your property’s performance.
The Operating Costs Nobody Mentions
Almost every amenity study focuses on ADR lift. Very few account for the cost drag that comes with premium amenities. That gap causes hosts to underestimate the margin they need to budget.
A hot tub in continuous guest use costs $1,440 to $3,720 per year in electricity, chemicals, and maintenance. A pool adds $3,000 to $6,000 per year. A game room has equipment that breaks and needs replacement over time. Pet-friendly policies increase turnover cleaning costs by $50 to $150 per stay. None of these costs negate the case for high-return amenities. But a host who models only the ADR upside is going to get a surprise in year two when the actual net looks different than the projection.
Three operating rules that matter:
- Build a maintenance reserve: Set aside 5% of the purchase price of any amenity per year for repairs. Hot tub motors fail. Pool equipment breaks. Budget for it before year one.
- Price your cleaning fee for the amenity: A hot tub requires a drain-refill-chemical cycle between guests. That is real labor time. Charge for it in your cleaning fee structure.
- Adjust for seasonality: In cold-weather markets, a hot tub operates year-round. In Scottsdale, a pool is closed for months. Match your operating cost estimate to actual usage months.
The hosts who extract the most revenue from premium amenities are the ones who price them correctly and maintain them like the revenue-generating assets they are. Your STR setup checklist should include operating protocols for any premium amenity before your first guest arrives.
Data in this article reflects 2026 research on active short-term rental listings. Amenity premiums vary by market, property type, and competitive conditions. Always verify current benchmarks for your specific market before making capital investment decisions.
Frequently Asked Questions
What amenities increase Airbnb bookings the most in 2026?
Hot tubs deliver the strongest ADR premiums in mountain and cabin markets, ranging from 14% nationally to 74% in markets like Gatlinburg. Dedicated workspaces with fast WiFi produce the highest return per dollar in urban and suburban markets. Pet-friendly policies generate 24% higher RevPAR nationally with relatively low setup cost. The best amenity for your property depends on your market type and primary guest profile.
Is a hot tub worth the investment for a short-term rental?
In mountain and cabin markets, yes, almost always. The ADR premium in markets like Gatlinburg (74%), Outer Banks (78%), and Nashville (57%) typically delivers a payback in under 18 months on a mid-range installation. In beach markets, the national average premium of 14% is still positive but the payback timeline is longer. Run the math with your specific market’s ADR benchmarks before committing.
Do EV chargers increase Airbnb bookings?
Yes, but modestly. The national average ADR lift is 6.8% and listings with EV chargers book approximately two additional nights per year. The installation cost ($600 to $1,500) is low enough that even modest returns justify it in markets with tech-forward, affluent guest profiles. Larger market-specific premiums in industry research often reflect selection effect rather than the charger alone.
What is the best low-cost amenity upgrade for an Airbnb?
A dedicated workspace with fast WiFi is the best return-per-dollar upgrade for most urban and suburban properties. Setup costs run $800 to $1,500 all-in and the impact on mid-week occupancy can be significant. An outdoor fire pit is a close second for mountain, lake, and rural properties: it costs under $2,000, adds 5.1% higher ADR nationally, and extends shoulder-season bookings by up to 30%.
What STR amenities are not worth the money?
Upgrading table stakes amenities produces zero measurable ADR premium. Smart TV upgrades, premium cable packages, HVAC replacements above baseline function, and additional streaming services are maintenance expenses, not revenue investments. Guests expect these at minimum quality. Meeting that expectation does not raise your rate. Upgrade budget spent on hot tubs, workspaces, or a pet-friendly policy produces far better returns.
Sponsored — OfferMarket
Buy Your First STR With Long-Term Rental Financing
Flexible, long-term financing for short-term rental buyers. Rates from 5.75%. Instant online quote, no credit pull.
Explore RTL Financing Options →Affiliate disclosure: StaySTRA may earn a referral fee.
Become a StaySTRA Insider
Join free — get our newsletter + 1 free property analysis/month.
No spam. Unsubscribe anytime. Free membership includes property analyses and market insights.