

Key Takeaways
- RevPAR (Revenue Per Available Room) equals your occupancy rate multiplied by your average daily rate, and it tells STR investors more about a market’s real earning potential than either number by itself.
- A market with 80% occupancy can badly underperform a market with 66% occupancy on RevPAR if the ADR gap is large enough. StaySTRA June 2026 data shows exactly this happening with Boise (80.5% occ, $142 RevPAR) vs Cape Cod (66.5% occ, $380 RevPAR).
- Sophisticated STR investors screen markets by RevPAR first, then break down the underlying ADR and occupancy to understand the “why” behind the number.
- Markets above $250 RevPAR consistently attract institutional-grade investor interest; markets below $150 warrant closer scrutiny before committing capital.
- StaySTRA’s location pages publish live occupancy and ADR data for any U.S. market, so you can compare targets in minutes instead of hours (Source).
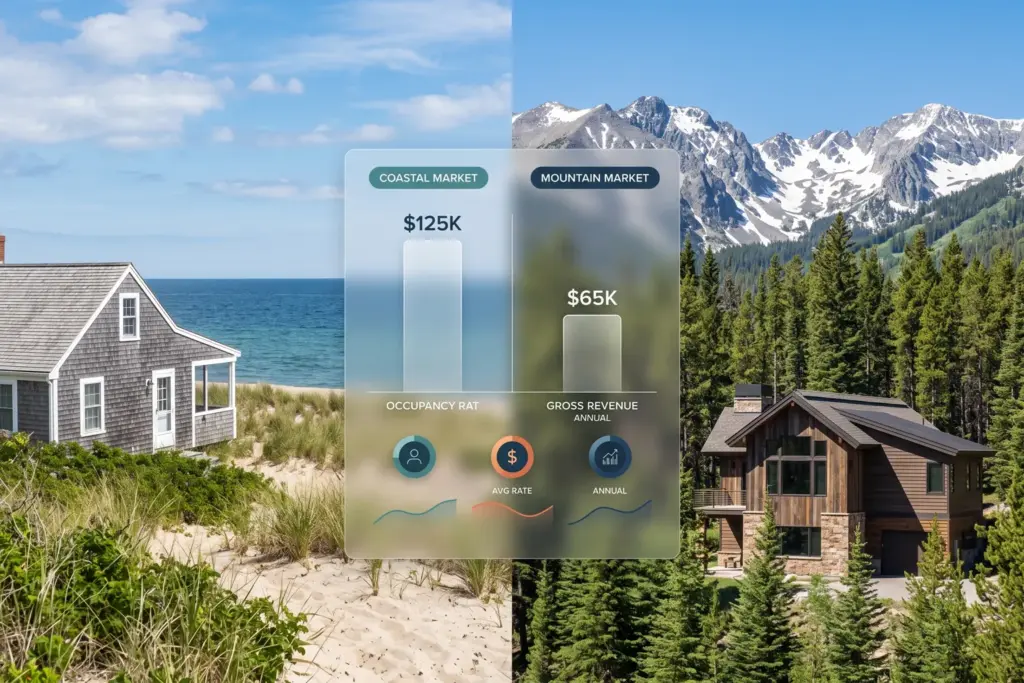
Cape Cod, Massachusetts posts a RevPAR of $380. Boise, Idaho posts $142. Now here is the part that trips up beginning investors: Boise’s occupancy rate is 80.5 percent. Cape Cod’s is 66.5 percent. If you were scanning markets on occupancy alone, you would choose Boise. But the host renting out a three-bedroom cottage on the Cape is capturing nearly three times the nightly revenue per available night.
That is what RevPAR captures, and it is exactly what most beginning investors overlook. I have been working with market data for going on 40 years now, and RevPAR remains the single number I reach for first when evaluating any new market. Not because it is complicated. Because it is not. It distills the entire ADR-occupancy trade-off into one figure that lets you compare markets fairly, even when they are playing completely different economic games.
What RevPAR Actually Is
The hotel industry invented RevPAR decades ago to solve a specific problem: operators kept gaming performance comparisons by cherry-picking whichever metric made them look best. A property with lots of empty rooms could boast a high ADR. A property filling every bed at a discount could boast high occupancy. Neither number told the whole story. RevPAR forced both into a single view.
Short-term rental investors face the same problem when comparing markets. Two markets at 70% occupancy can produce completely different financial outcomes depending on what the ADR looks like. Two markets at $250 ADR can produce completely different outcomes depending on how often those units are booked. RevPAR normalizes the comparison.
The formula is straightforward. Think of it like a batting average for your nightly revenue potential:
RevPAR = Occupancy Rate x ADR
That is the whole formula. Multiply your occupancy rate (expressed as a decimal or percentage) by your average daily rate, and you get the average revenue your property earns for every night it sits on the market, whether booked or not.
A quick example to ground it: if your market runs 70% occupancy and the average daily rate is $200, your RevPAR is $140. That $140 reflects what an available night actually earns on average across the market, accounting for the nights that go unbooked.
Why ADR and Occupancy Each Tell Half the Story
Stay with me here, because this is where most investors I talk with have their lightbulb moment.
Imagine two markets. Market A has 75% occupancy and a $200 average daily rate. Market B has 60% occupancy and a $350 average daily rate. Which market would you rather invest in?
On occupancy alone, Market A wins. On ADR alone, Market B wins. On RevPAR, the comparison is no longer ambiguous:
- Market A: 75% x $200 = $150 RevPAR
- Market B: 60% x $350 = $210 RevPAR
Market B generates 40% more revenue per available night despite filling its calendar less often. If your objective is total revenue capture, and for most investors it is, Market B is the stronger performer here. The difference is that Market B’s nightly rate more than compensates for its empty nights. Market A’s occupancy advantage evaporates the moment you do the multiplication.
This is not a hypothetical. Real markets behave exactly this way, and StaySTRA data shows it across dozens of U.S. markets right now.
ADR misleads investors in the other direction just as reliably. Don’t let that number fool you in isolation. A high ADR can be entirely illusory if occupancy is soft. A market averaging $400 per night at 40% occupancy posts a $160 RevPAR. That is a mediocre market regardless of how impressive the nightly rate sounds in a listing headline.
Real Market Pairs: What StaySTRA Data Shows
StaySTRA tracks RevPAR, ADR, and occupancy for hundreds of U.S. markets. The June 2026 data surfaced some instructive contrasts that are worth walking through carefully, because they illustrate the RevPAR story better than any textbook example I could construct.
Boise vs. Cape Cod
Boise, Idaho is a solid, growing market with genuinely impressive occupancy. At 80.5%, hosts there fill their calendars as reliably as almost anywhere in the country. But the ADR sits at $176, which means RevPAR lands at $142. That is a functional market, but a competitive one with thin per-night economics.
Cape Cod, Massachusetts operates on an entirely different model. Occupancy runs 66.5%, which by Boise standards looks modest. But the average daily rate is $572 per night. Multiply those together and Cape Cod’s RevPAR reaches $380. Three markets’ worth of RevPAR stacked on top of one another, compared to Boise, despite lower occupancy.
The investor who screens on occupancy alone lands in Boise. The investor who screens on RevPAR starts the Cape Cod conversation.
Portland vs. Sonoma
Portland, Oregon is a genuinely well-occupied market. Hosts there run 78.8% occupancy, which is strong by any measure. But Portland is a supply-heavy urban market with a $179 average daily rate, producing a $141 RevPAR. The occupancy is real. The revenue per night is modest.
Sonoma, California tells a different story. Occupancy runs 63.1%, nearly 16 points below Portland. But Sonoma’s wine country draw commands a $518 average daily rate. RevPAR lands at $327. Despite booking fewer nights, the average Sonoma host captures more than twice Portland’s revenue per available night.
This contrast is not about one market being objectively “better.” Portland hosts understand their market and many do very well there. The point is that occupancy alone would lead a naive investor to prefer Portland. RevPAR shows what the nightly economics actually look like.
Denver vs. Long Island
Denver, Colorado has strong occupancy at 78.4%, respectable ADR at $201, and produces a $158 RevPAR. It is a market worth watching.
Long Island, New York runs 62% occupancy. That looks soft compared to Denver. But Long Island’s average daily rate reaches $753, a premium driven by proximity to New York City, summer beach demand, and genuinely limited supply. RevPAR comes out at $465, the highest in StaySTRA’s June 2026 data set.
The occupancy-focused investor looks at Long Island’s 62% and moves on. The RevPAR-focused investor recognizes that Long Island hosts capture more revenue per available night than almost any other market in the country.
What RevPAR Ranges Actually Signal
After working with STR market data for years, I have developed a rough framework for reading RevPAR signals. This is not a hard rule. Markets are complex organisms, and local factors always matter. But as a starting screen, it holds up well.
Below $150 RevPAR: Tread carefully. These markets often have one of two problems. Either supply has outrun demand and ADR has compressed, or the market runs on high occupancy but at rates that leave thin margins after expenses. That does not mean you cannot build a profitable property here, but the economics require a sharper pencil.
$150 to $250 RevPAR: Solid mid-tier territory. These markets support profitable investment for operators who are attentive to costs and pricing strategy. Many solid urban markets live in this band, including Denver and Boston at various points in the year.
$250 to $400 RevPAR: Strong performer range. Markets in this band tend to attract repeat investor capital and often have characteristics (natural constraints on supply, strong demand drivers, or both) that protect returns. Cape Cod, Sonoma, and San Diego cluster here.
Above $400 RevPAR: Premium market territory. Long Island and a handful of elite coastal and resort markets sit here. Entry costs are higher, but so is the revenue ceiling. These markets often have supply constraints (regulatory caps, geographic limits, or both) that make the RevPAR sustainable.
StaySTRA’s location pages show the occupancy and ADR that place any target market within this spectrum before you ever put in an offer (Source). More on that below.
Why This Number Matters More in 2026
The STR market is maturing. The days when you could buy almost any property in a tourist destination and count on occupancy to carry you are behind us in most markets. Supply has expanded substantially across high-demand areas since 2020, which means the same occupancy rate that looked great in 2022 now comes with more competition for each booking.
In that environment, ADR discipline matters more than it ever has. Hosts who understand RevPAR think differently about pricing. They know that a 5-point drop in occupancy is acceptable if it comes with a 20% ADR increase that more than offsets it. Hosts who optimize for occupancy alone tend to race to the bottom on pricing to fill the calendar.
The broader market data reflects this dynamic. Markets where STR supply has expanded fastest tend to show occupancy holding steady or even rising, while RevPAR softens as ADR compresses. A beginning investor reading occupancy alone would see a healthy market. A RevPAR screen catches the compression before you commit capital.
This is one reason I always tell new investors: buying an Airbnb property starts with a market screen, and the market screen starts with RevPAR.
How RevPAR Connects to Your Financing
Here is something investors with DSCR loans figured out before anyone else: RevPAR is the metric that most directly predicts your debt service coverage ratio.
DSCR lenders underwrite STR properties based on projected gross rental income. That projection is built on market-level occupancy and ADR assumptions. In other words, it is built on RevPAR. A market with a $380 RevPAR is going to underwrite at a meaningfully different monthly revenue than a $142 RevPAR market, and that difference flows straight through to whether you qualify for the loan and at what rate.
Investors who walk into a DSCR lender conversation knowing their target market’s RevPAR are simply better prepared. They have an honest read on what the market will generate, not what it will generate on a fully-booked week in August. RevPAR is the whole-year average, accounting for shoulder seasons and slow months. It is the number the lender’s underwriting model needs, whether the lender frames it that way or not.
If you want to explore financing options for a market you are considering, StaySTRA’s analysis of the 2026 investment landscape provides context on where capital is flowing and which markets the financing environment currently favors.
How to Pull RevPAR Using StaySTRA Location Pages
I want to be practical here because the number is only useful if you can actually find it for your target market.
Each StaySTRA location page gives you headline-tier occupancy and ADR for any U.S. market in the database (Source). You do not need to pull occupancy from one source and ADR from another and hope they are comparable. The location page pulls from the same underlying dataset, so the occupancy and ADR figures are internally consistent.
What the location page shows at the headline level:
- Average monthly revenue for the market overall (Source)
- Average occupancy rate
- Average daily rate
- Market score (a composite signal that incorporates multiple data points)
The step I recommend: before you put any market on your serious shortlist, pull up its location page and multiply its occupancy by its ADR to get the RevPAR figure (Source). Use the ranges above as your initial screen. Markets above $250 get a closer look. Markets below $150 require a strong thesis about why your specific property will outperform the market average.
Once you have narrowed to two or three target markets, go deeper on each. The location pages for each market give you additional context on what drives the RevPAR, including demand seasonality and market characteristics. But RevPAR is the right starting point, not the ending point.
For a broader view of which markets are generating the strongest returns across the country right now, the best Airbnb markets to invest in for 2026 analysis is worth a read before you settle on a target.
What Sophisticated Investors Do Differently
The investors I see making smart decisions in this market all use RevPAR as an entry filter. They do not use it as the only filter, but they use it first. Here is the practical approach:
Step one: screen by RevPAR. Pull RevPAR for every market on your initial list. Eliminate markets below your minimum threshold, whatever that is based on your financing requirements and return targets. You might lose some markets that would have worked, but you are protecting your time.
Step two: decompose the RevPAR. For every market that passes the initial screen, look at the occupancy and ADR underneath it. Two markets at $280 RevPAR can have very different profiles. One might get there with 75% occupancy at $373 ADR. Another might get there with 55% occupancy at $509 ADR. The second market has more upside if you can push occupancy, more downside risk if something hits demand. These are different bets.
Step three: compare RevPAR to acquisition cost. A $380 RevPAR market where properties cost $1.2 million is a different investment than a $380 RevPAR market where properties cost $550,000. RevPAR per dollar of acquisition cost (a crude yield-adjacent metric) tells you which market delivers more revenue for each dollar you put in.
None of this replaces a full underwriting analysis. I always tell investors: the RevPAR screen narrows the field, it does not close the deal. But it is the fastest way I know to cut a long market list down to the two or three that actually deserve your attention.
A Note About What RevPAR Does Not Tell You
RevPAR is a market average. Your property will not perform at the market average unless it is perfectly average in every way. Properties with strong reviews, premium amenities, excellent location within the market, and sharp pricing strategy will outperform the RevPAR benchmark. Properties that are poorly maintained, hard to find, or priced without strategic intent will underperform it.
Market RevPAR tells you what the playing field looks like. Your operational execution determines where you land on it.
It also does not tell you about expenses. A $300 RevPAR market with high property taxes, strict regulations requiring expensive compliance, or seasonal utility bills can underperform a $200 RevPAR market with lower carrying costs. RevPAR is a gross revenue signal, not a net cash flow signal. Fold your market-specific expense assumptions in after you have used RevPAR to get to the right markets.
We do our best to keep our data accurate and up to date, but markets move fast and we are only human. Always verify current figures directly with local sources before making investment decisions.
Frequently Asked Questions
What does RevPAR mean for short-term rentals?
RevPAR stands for Revenue Per Available Room (or rental, in the STR context). It is calculated by multiplying your occupancy rate by your average daily rate. For example, a market with 70% occupancy and a $250 ADR produces a $175 RevPAR. The number tells you how much revenue a property generates per available night on average, including the nights it sits empty. It is the most efficient single-number comparison across STR markets with different pricing models.
Is a higher RevPAR always better for STR investors?
Higher RevPAR means higher gross revenue per night available, which is generally a positive signal. But it does not account for acquisition cost, operating expenses, or regulatory risk. A $400 RevPAR market where properties sell for $2 million may produce a weaker return than a $200 RevPAR market where properties sell for $400,000. RevPAR is best used as an initial screening tool, not a complete investment decision.
What is a good RevPAR for an Airbnb market in 2026?
Based on StaySTRA’s June 2026 market data, RevPAR above $250 places a market in strong-performer territory, with markets above $400 representing elite coastal and resort destinations. Markets in the $150 to $250 range are viable for well-run properties but offer thinner margins. Markets below $150 warrant closer scrutiny of whether your specific property thesis can overcome the market-level headwinds.
How is STR RevPAR different from hotel RevPAR?
The formula is identical, and the concept is borrowed directly from hospitality: both multiply occupancy by average daily rate. The difference is that STR RevPAR reflects an entire market’s aggregate performance rather than a single property’s inventory. It is a market benchmark, not a property-level figure. Your individual property’s RevPAR will differ from the market average based on your property’s quality, location, pricing strategy, and management.
Where can I find RevPAR data for my target market?
StaySTRA’s location pages publish headline-tier occupancy and ADR for hundreds of U.S. markets, drawn from the same underlying market database (Source). You can check your target market’s occupancy and ADR in one place before committing to any market analysis. The data is updated regularly and reflects aggregate market performance rather than individual listing projections.
Ready to check RevPAR for your target market before you make a move? The StaySTRA location page for that market gives you the headline numbers in seconds.
Sponsored — Beeline
Finance Your Next STR With a DSCR Loan
Qualify on property cash flow, not W-2 income. Beeline specializes in fast DSCR closings for STR investors. No personal income verification required.
Check Your DSCR Eligibility →Affiliate disclosure: StaySTRA may earn a referral fee.
Become a StaySTRA Insider
Join free — get our newsletter + 1 free property analysis/month.
No spam. Unsubscribe anytime. Free membership includes property analyses and market insights.



