

Key Takeaways
- Jackson Hole led summer 2026 with 45.5% of STR properties pre-booked for June through August, and the surrounding Teton Valley area hit 83.2% occupancy in June, the highest of any leisure market in StaySTRA’s dataset.
- With Labor Day falling on September 7, mountain markets that built long booking leads all summer are the most likely to be full or nearly full as of mid-August, while urban getaway markets still show more remaining inventory for last-minute holiday travelers.
- Beach markets tracked two trajectories heading into Labor Day: Gulf Shores and Destin held occupancy above 82% in June, while softer Southeastern beach markets saw occupancy slip 3-4 points year-over-year.
- STR supply growth has stalled at 2.7% nationally in 2026, well below the 20% peak additions of 2021 and 2022, which means any pre-booking strength reflects genuine demand compressed into a tighter inventory base.
- Investors watching Q3-Q4 positioning should treat Labor Day occupancy as an early signal: markets that hold strong through the holiday tend to carry higher baseline occupancy into the fall and winter off-season.
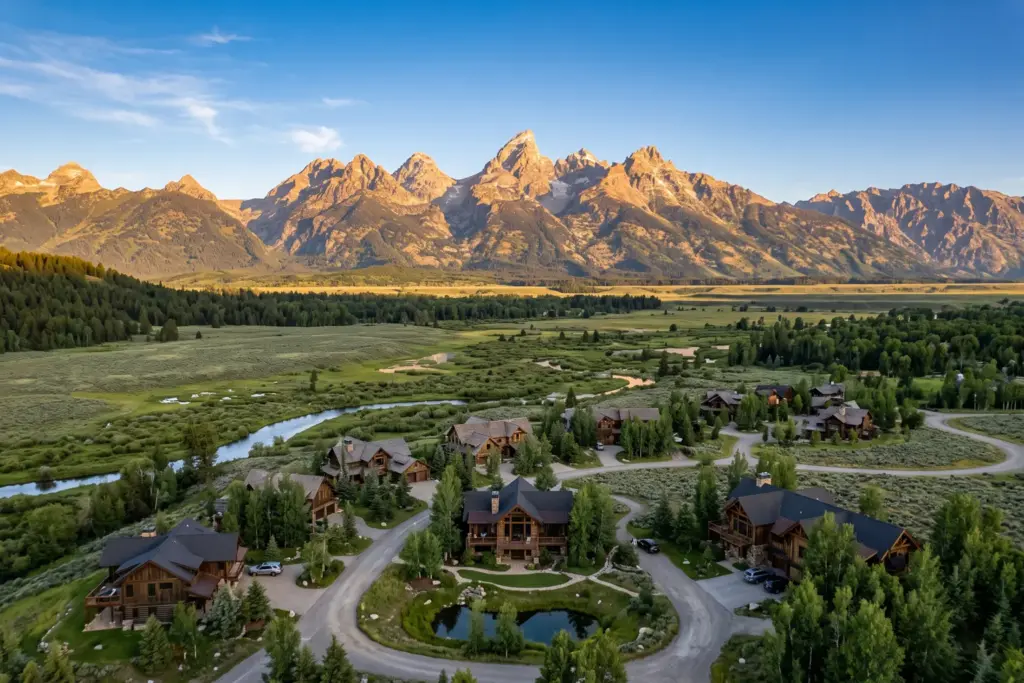
The Teton Valley area surrounding Jackson Hole, Wyoming, hit 83.2% occupancy in June 2026, the highest single-market reading in the StaySTRA dataset, and by early August, 45.5% of Jackson Hole properties were already reserved for the full summer window. Think of that 45.5% figure the way you would think about sell-through at a major event: when more than four in ten seats are gone before the doors open, the remaining inventory commands a premium and the operators running those properties are in a very different position than those scrambling to fill calendars. That is exactly the dynamic playing out in mountain STR markets heading into Labor Day weekend.
Labor Day falls on September 7 this year. That puts us, right now on August 18, exactly three weeks out from the last leisure-premium weekend of the summer season. Heading into this window, StaySTRA data tells a nuanced story. Not all markets are filling at the same pace, and not all pre-booking strength means the same thing for investors. The supply backdrop, which matters more than people realize, makes even moderate pre-booking rates more meaningful than they look on the surface.
Let me walk you through what the data actually shows.
The National Picture: Demand Is Healthy, But the Story Lives Underneath the Headline
AirDNA’s midyear 2026 report confirmed what StaySTRA data has been signaling since spring: the STR market correction is over. National occupancy is running at 57.4%, just above the pre-pandemic average of 57.0%, and RevPAR is on track for a 2.9% annual gain. That sounds modest, but in a market that spent 2023 and 2024 working through an oversupply hangover, it is actually a meaningful inflection.
Supply growth has stalled. The industry added new listings at roughly a 2.7% annual rate in 2026, compared to a 20% expansion at the height of the 2021 and 2022 rush. Higher mortgage rates, which climbed back above 6% this year, kept many prospective investors on the sidelines and limited new inventory from hitting the market.
Stay with me here, because that supply context matters a great deal for how you read a pre-booking rate. When supply was expanding rapidly in 2021 and 2022, a market at 60% pre-booked occupancy was competing against hundreds of new listings trying to fill at the same time. In 2026, with far fewer new properties entering the equation, that same 60% forward occupancy is backed by a leaner pool of competing inventory. Every percentage point of forward booking strength is worth more than it used to be.
For Labor Day weekend specifically, the national booking pattern matters. Holiday weekends draw concentrated demand from drive-market travelers, families extending the summer, and groups looking for one more long-weekend getaway before September changes the pace. Markets within four to five hours of major population centers, whether mountain, beach, or lake, see the sharpest demand spikes around this holiday. The question for investors is which market categories are converting that demand most efficiently heading into September.
Mountain Markets: Jackson Hole Leads, and the Teton Valley Signal Is Hard to Ignore
If you have been following our coverage of the Jackson Hole market this summer, the August 10 StaySTRA report established that the market topped all U.S. destinations with 45.5% of properties reserved for the June-through-August window. At the time of that report, the closest competitor was Cape Cod, Massachusetts, at 44%.
What the broader Teton Valley dataset adds to that picture is context about where the market sits in actual in-season occupancy. StaySTRA data shows the Teton Valley area, which includes the Idaho-side communities serving Jackson Hole’s visitor base, at 83.2% occupancy in June 2026. That is a 5.4% gain year-over-year and represents the highest occupancy reading of any leisure market in our dataset for that month.
The implication for Labor Day is direct. Mountain markets that drove strong occupancy through June and July, and that already showed 45.5% reservation rates by early August, are the ones most likely to be completely or near-completely sold out for the September 7 weekend. Don’t let that number scare you off mountain market analysis, though, because for investors already holding in the Jackson Hole corridor or the broader Teton ecosystem, that is a strong validation of the thesis. For prospective buyers considering mountain acquisitions, it establishes a useful benchmark: this is what a high-conviction mountain market looks like at peak performance.
Gatlinburg and Pigeon Forge in the Smoky Mountains tell a slightly different story. StaySTRA data shows June 2026 occupancy at 68.7%, down 1.7% year-over-year, with an average daily rate of $395. Average monthly revenue in the Gatlinburg market comes in at $7,575. The modest ADR decline of 3.5% reflects some competitive pressure from the market’s large listing base, which runs roughly 23,050 active units against the backdrop of 12.2 million annual visitors to Great Smoky Mountains National Park. The market is not in distress. That structural demand floor makes Gatlinburg resilient, and Labor Day is one of the market’s strongest pull weekends. But investors should understand they are working with a market that is moderately softening on rate, not accelerating.
Asheville, North Carolina, is the mountain market that actually strengthened into summer. StaySTRA data shows June 2026 occupancy at 61.8%, up 5.5% year-over-year, with ADR of $248, up 3.6% from the same month in 2025. That combination of occupancy and rate gains in the same direction is exactly the pattern that signals genuine demand improvement rather than rate-cutting to fill calendars. Asheville heading into Labor Day is running with positive momentum on both the revenue and occupancy sides, which is a useful profile for an investor evaluating a Q3 acquisition in a mountain market with more accessible price points than Jackson Hole or Vail.
Sponsored — Beeline
Finance Your Next STR With a DSCR Loan
Qualify on property cash flow, not W-2 income. Beeline specializes in fast DSCR closings for STR investors. No personal income verification required.
Check Your DSCR Eligibility →Affiliate disclosure: StaySTRA may earn a referral fee.
Beach Markets: Two Different Waves
Beach markets split into two distinct groups heading into Labor Day 2026, and the StaySTRA data makes the dividing line clear.
Gulf Shores, Alabama, and Destin, Florida, sit in the strong group. Gulf Shores reached 82.4% occupancy in June 2026, up 2.1% year-over-year, with an average daily rate of $495 and average monthly revenue of $11,156, one of the strongest revenue figures of any market in this analysis. Destin posted June occupancy of 83% and maintained ADR above $525, supported by a high concentration of premium waterfront inventory and a guest profile that books further ahead than most coastal markets. Both destinations benefit from their position as short drives from Atlanta, Birmingham, Nashville, and Memphis, making them first choices for mid-South families planning a last summer getaway before school schedules take over completely.
Panama City Beach is running at a similar occupancy trajectory to Gulf Shores, at 83.6% occupancy in June 2026, up 2.5% year-over-year. The Gulf of Mexico’s Emerald Coast corridor, taken as a whole, is holding its ground heading into Labor Day in a way that suggests the demand base is solid rather than promotional.
The second group is where caution belongs. Myrtle Beach came into June at 73.9% occupancy, down 3.9% year-over-year, with ADR declining 6.3% as well. That simultaneous drop in both occupancy and rate is a warning pattern. It suggests supply outpacing demand in that particular market segment, or a traveler mix shifting toward lower-rated properties as higher-end guests migrate to other destinations. The Labor Day bump will be real in Myrtle Beach, but hosts are entering that window at a weaker baseline, which limits the upside.
Miami shows an interesting divergence from most beach markets. June 2026 occupancy came in at 59%, down 4.2% year-over-year, but ADR climbed 5.8% to $275. That split, where occupancy softens while rate holds or rises, can signal that the lower-performing listings are exiting the active market while quality-tier operators maintain pricing discipline. Miami has faced structural headwinds from regulatory complexity and international tourism weakness this year. But the ADR story suggests the quality tier of the Miami STR market is holding its position, and Labor Day weekend in Miami tends to draw a distinct urban event traveler that differs from the family beach crowd driving Gulf Coast demand.
Lake markets deserve a separate note. As a category, lakes are difficult to read from monthly average data because the geometry of lake destination STR demand is so concentrated around weekends. A lake market running at 55% monthly average occupancy might be tracking at 85% Friday through Sunday, with midweek periods dragging the headline figure down. For Labor Day weekend, lake markets within drive range of major metros, including Lake Tahoe from the Bay Area, the Ozarks from Kansas City and St. Louis, and the Great Lakes shoreline from Chicago and Detroit, tend to see extremely sharp short-window demand around the holiday. Investors evaluating lake market acquisitions should look at weekend-specific and holiday-specific occupancy data, available through the StaySTRA Analyzer, rather than monthly headline averages alone.
Urban Weekend Markets: Different Mechanics, Real Opportunity
Nashville, Denver, and Charleston tell a story that is distinct from both mountain and beach markets, and it is worth understanding why urban getaway markets behave the way they do around Labor Day.
Urban getaway markets tend to run a different booking curve. They draw a more mixed traveler profile: bachelorette groups, destination event travelers, city-curious weekenders, and some business hybrid travel. Nashville’s StaySTRA data shows 65% average occupancy and an average daily rate of $329, with average monthly revenue of $5,908. Year-over-year revenue growth for Nashville is 7.9%, the strongest revenue gain of any market in this analysis, driven by a combination of modest occupancy improvement (up roughly 3% year-over-year) and ADR holding steady near its prior peak.
Nashville’s Labor Day position is interesting because it does not depend entirely on summer leisure demand. The city draws group event travelers year-round, and the Saturday night of Labor Day weekend in Nashville looks almost identical to any other high-demand Saturday in the market’s calendar. For investors, that means a Nashville Labor Day signal is less about whether summer demand is peaking and more about whether the market’s fundamental guest base is stable. The 7.9% revenue growth number suggests it is.
Denver came into June at 78.4% occupancy, which sounds strong, but it is down 2.3% year-over-year with ADR also off 3.9%. Denver is working through a period of adjustment: a large listing base, some regulatory complexity, and competition from the Rocky Mountain resort towns for the same weekend traveler. Labor Day is a meaningful weekend for Denver given its proximity to hiking and outdoor recreation access, but investors should not expect the same pricing power they would find in a constrained mountain market two hours up the road.
Charleston, South Carolina, is the urban market that most closely resembles a leisure-destination in its behavior. June 2026 occupancy was 78.7%, essentially flat year-over-year but at a high absolute level, with ADR of $548, the strongest of any urban market in our dataset. Charleston benefits from historic district constraints that limit new hotel supply and an STR permitting environment that has kept listing growth in check. Both factors give existing operators more pricing leverage. For Labor Day, Charleston draws strongly from Atlanta, Charlotte, and the Research Triangle, all within a few hours’ drive, which supports consistent weekend demand.
Sponsored — Beeline
Finance Your Next STR With a DSCR Loan
Qualify on property cash flow, not W-2 income. Beeline specializes in fast DSCR closings for STR investors. No personal income verification required.
Check Your DSCR Eligibility →Affiliate disclosure: StaySTRA may earn a referral fee.
What the Pre-Booking Data Means for Investors Watching Q3 and Q4
Here is the part I want you to sit with, especially if you are evaluating an acquisition right now or deciding whether to hold through the off-season.
I have been reading market data since before many of this industry’s investors were born. Forty years of it, first as a government statistician and now from a desk in Santa Fe with a Pueblo pottery collection on one side and a fresh pot of black coffee on the other. In all that time, the pattern I keep coming back to is this: Labor Day pre-booking strength is not just a single-weekend revenue data point. It is a leading indicator of how a market is likely to perform in the shoulder and off-seasons. Think of it the way a farmer thinks about harvest month: a strong August harvest does not guarantee a comfortable winter, but it tells you something important about the soil and the crop. Markets that hold occupancy through Labor Day without cutting their nightly rate tend to carry that pricing discipline into October and November. Their guest base is willing to pay for the experience, and those guests do not disappear after the holiday weekend; they shift to fall foliage weekends, Thanksgiving, and the winter holiday window.
The markets that fit this description in 2026 are the mountain destinations (Jackson Hole, Asheville, parts of the Smokies), the top Gulf Coast beach markets (Gulf Shores, Destin, Panama City Beach), and the urban leisure markets with constrained supply (Charleston, Nashville). The common thread across all of them is some form of supply constraint, whether geographic, regulatory, or demand-driven, that keeps new inventory from diluting the existing revenue pool.
For prospective buyers deciding whether to close before Labor Day or wait: the supply environment in 2026 is not going to soften the acquisition market significantly after September 7. Sellers in strong markets know what their forward calendars look like. If a market is holding occupancy gains year-over-year with stable or rising ADR, the seller’s conviction in their asking price is not going to erode because summer is ending. If anything, a strong Labor Day for the market strengthens their position.
The more actionable timing signal is for existing hosts doing their own benchmarking right now. If your Labor Day weekend calendar is not tracking in line with the market occupancy levels described here, that is something to address in the next ten to fourteen days. Nightly rate adjustments, minimum stay changes, and listing quality improvements can still influence last-minute bookings with three weeks remaining before the holiday.
For the full forward-booking analysis by market, including seasonal occupancy curves and how your specific location compares, that depth lives on each StaySTRA location page and the 2026 supply trends report. The StaySTRA 2026 market overview covers the broader context for understanding which market categories are positioned strongest heading into Q4. And if you want to see how Labor Day pacing data connects to DSCR loan qualification math for a specific market, the StaySTRA best Airbnb markets guide is the right starting point for building that investment case.
We do our best to keep our data accurate and up to date, but markets move fast and we are only human. Always verify current figures directly with local sources before making investment decisions.
Frequently Asked Questions
Which STR markets are filling fastest for Labor Day 2026?
Mountain markets are tracking the strongest. StaySTRA data shows the Teton Valley area surrounding Jackson Hole hit 83.2% occupancy in June 2026, and 45.5% of Jackson Hole properties were already pre-booked for the full summer window by early August. Gulf Coast beach markets including Destin (83% June occupancy) and Gulf Shores (82.4%) are also running at high utilization. Urban getaway markets like Nashville and Charleston show strong fundamentals but typically maintain more available inventory closer to holiday weekends than mountain destinations do.
What does Labor Day pre-booking data tell STR investors about Q4 revenue?
Markets that hold occupancy through Labor Day weekend without discounting their nightly rates tend to carry disciplined pricing into the fall and winter shoulder seasons. Strong Labor Day pre-booking in a constrained supply environment signals genuine demand depth rather than last-minute filling at reduced rates. Investors evaluating Q4 performance should treat Labor Day occupancy trajectory as an early indicator of how a market’s guest base behaves once the peak summer window closes. Markets showing year-over-year occupancy gains heading into the holiday, like the Teton Valley area and Gulf Shores, are the ones most likely to demonstrate stronger-than-average shoulder-season performance.
How does STR supply tightening in 2026 affect Labor Day booking rates?
National STR listing growth stalled at 2.7% in 2026, far below the 20% expansion rates of 2021 and 2022. With fewer new properties entering the market, any forward occupancy reading represents a larger share of a more constrained inventory pool. A market at 75% pre-booked occupancy heading into Labor Day 2026 is operating in a structurally different competitive environment than that same market at 75% in 2022. Fewer competing listings means each booked night carries more revenue significance and hosts have more leverage on the remaining open dates. The supply constraint is one of the most important context factors for reading this year’s pre-booking data.
Are beach or mountain STR markets better for Labor Day investors in 2026?
The data in 2026 favors mountain markets on occupancy trajectory and pricing durability. Jackson Hole’s Teton Valley area posted the highest June occupancy in the StaySTRA dataset at 83.2%, while Asheville showed a strong combination of both occupancy and ADR gains year-over-year. Top beach markets like Gulf Shores and Destin are competitive, but some coastal markets are seeing occupancy and rate declines simultaneously, which reduces the Labor Day premium opportunity. Mountain markets tend to have a guest profile that commits earlier and a supply base that is more constrained by geography, both factors that support stronger pricing through holiday weekends.
What is the best way to benchmark my STR’s Labor Day performance against the market?
Compare your forward occupancy and nightly rate for Labor Day weekend against the market-level benchmarks for your city using a data source that tracks active listings. StaySTRA’s location pages show occupancy, ADR, and seasonal demand patterns for each market, and the StaySTRA Analyzer allows property-level comparisons against those market benchmarks in real time. If your property is tracking below the occupancy levels noted in this article with three weeks remaining before Labor Day, that is an actionable gap. Pricing adjustments and minimum stay changes can still influence last-minute bookings at this point in the booking window.
Sponsored — Beeline
Finance Your Next STR With a DSCR Loan
Qualify on property cash flow, not W-2 income. Beeline specializes in fast DSCR closings for STR investors. No personal income verification required.
Check Your DSCR Eligibility →Affiliate disclosure: StaySTRA may earn a referral fee.
Ready to run the numbers on a market before the Labor Day window closes? The StaySTRA Analyzer pulls live market data for any U.S. STR location so you can see occupancy, ADR, and revenue benchmarks before you make an offer. Get the data that helps you understand exactly where a market stands heading into Q4.
Become a StaySTRA Insider
Join free — get our newsletter + 1 free property analysis/month.
No spam. Unsubscribe anytime. Free membership includes property analyses and market insights.



