

Key Takeaways
- National short-term rental ADR on the July 4th 2026 weekend rose 5.5% year over year, with RevPAR climbing 12.4%, per Key Data’s summer 2026 STR performance report
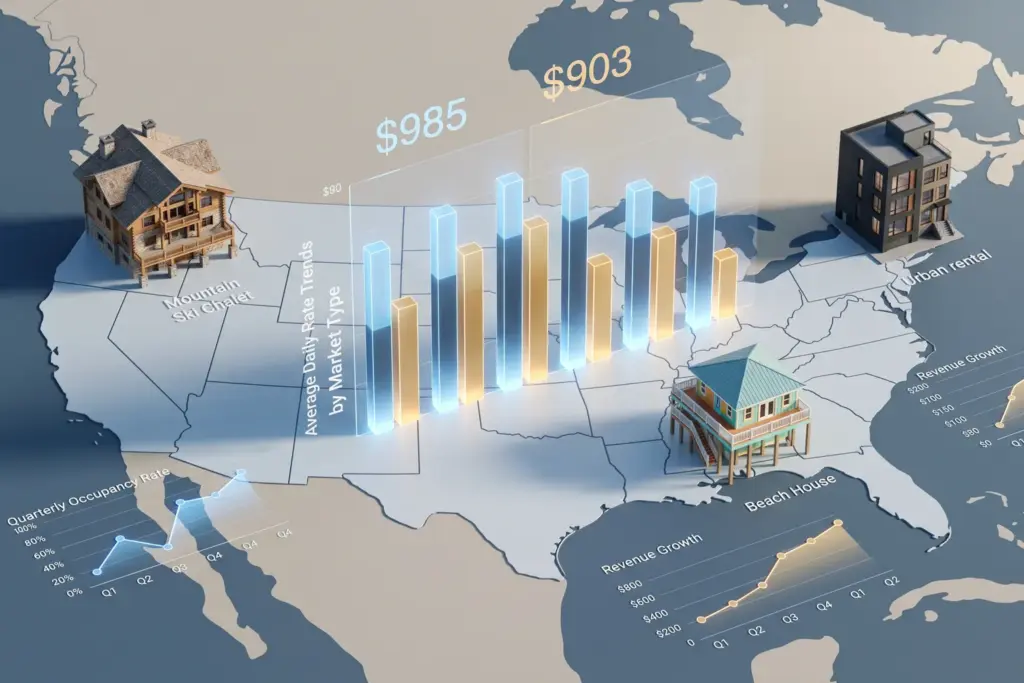
- Mountain and luxury coastal markets lead the StaySTRA dataset: Park City, UT reached $985 ADR, Key West, FL hit $903, and Scottsdale, AZ posted $587 in early 2026
- The biggest year-over-year ADR gains came from Gulf Coast beach markets: Myrtle Beach (+58%), Gulf Shores (+40%), Destin (+40%), and Panama City Beach (+44%) from February 2025 to February 2026
- Only 3 of the 50+ markets tracked in this analysis posted declining ADR versus the prior year; most have stabilized or grown meaningfully since the 2023 supply-driven compression
- For DSCR borrowers, market ADR is the single most important underwriting variable: high-ADR markets generate gross revenues that cover debt service at purchase prices that would be impossible to pencil in lower-ADR markets
Park City, Utah’s average daily rate hit $985 in February 2026, up 9.3% from the same month a year earlier. That number stopped me the first time I pulled it up here in Santa Fe, black coffee going cold beside my keyboard. Three years of “Airbnb bust” coverage, and here is one of the country’s best-documented vacation rental markets running within spitting distance of four figures per night.
I have spent forty years working with economic and market data, first as a government statistician, now in private research. When a widely predicted correction produces results this uneven across markets, the data is telling you something the headlines are not. The short-term rental correction of 2022 to 2023 was real in some markets, for a specific window of time. In others, it essentially did not happen. And by mid-2026, even markets that did correct have largely come back.
This article draws on StaySTRA data across more than 50 tracked markets to show where average daily rates actually stand in 2026, how they moved since the 2021 to 2022 peak, and what the July 4th weekend data says about the summer ahead. The goal is not to cheerlead. The goal is to give investors a clear data picture to work from.
The 2022 Peak, and What the Numbers Actually Showed
The short-term rental market’s 2021 to 2022 run was unlike anything in the industry’s prior history. Pent-up travel demand collided with a structurally tight supply of listings. Every market category saw ADR climb. New hosts entered by the millions. The financial press called it a gold rush.
What followed in late 2022 and through 2023 was a supply response. New listings poured in. Occupancy rates in many markets compressed as the supply-demand ratio shifted. Revenue per available night (RevPAR) fell. And the same press that had spent two years calling the market a gold rush spent the next eighteen months calling it a bust.
Think of ADR and occupancy like two legs of a table. When both legs were growing in 2021 and 2022, the table looked perfectly stable. When occupancy compressed in 2023, ADR in some markets softened to compensate. But the table did not fall for most markets. The operators who stayed priced correctly and waited for supply growth to slow found that by 2025 the table was standing again, often taller than before.
The supply growth that pressured occupancy has slowed materially heading into 2026. That shift, combined with resilient leisure travel demand, is the macro story behind the ADR recovery showing up in the market-level data below.
Where ADR Stands in 2026: The Full Market Picture
The table below draws on StaySTRA data from the airroi_market_metrics_all dataset. February 2026 is the most recent full month available at publication. Year-over-year comparisons use February 2025 as the baseline, controlling for seasonal patterns by comparing the same calendar month.
Note that February is peak season for ski and mountain resort markets and off-season for Gulf Coast and Atlantic beach markets. The absolute ADR figures reflect that seasonality. The year-over-year percentage changes are the more reliable indicator of trend direction.
| Market | State | Feb 2026 ADR | YoY Change | Market Type |
|---|---|---|---|---|
| Park City | UT | $985 | +9.3% | Mountain/Ski |
| Key West | FL | $903 | +17.0% | Island/Coastal |
| South Lake Tahoe | CA | $610 | +22.5% | Mountain/Lake |
| Scottsdale | AZ | $587 | +22.9% | Desert Resort |
| Mammoth Lakes | CA | $583 | +8.1% | Mountain/Ski |
| Big Bear Lake | CA | $541 | -2.4% | Mountain/Lake |
| New Orleans | LA | $472 | +7.5% | Urban |
| Charleston | SC | $440 | +28.9% | Coastal/Urban |
| Sedona | AZ | $439 | +13.7% | Desert Resort |
| Destin | FL | $425 | +40.4% | Beach |
| Broken Bow | OK | $414 | +9.3% | Mountain/Rural |
| Port Aransas | TX | $409 | +30.0% | Beach |
| Bradenton | FL | $407 | +18.5% | Beach |
| Orange Beach | AL | $383 | +33.1% | Beach |
| Gulf Shores | AL | $368 | +40.5% | Beach |
| Sarasota | FL | $377 | +21.7% | Beach |
| Phoenix | AZ | $373 | +11.2% | Urban/Resort |
| Blue Ridge | GA | $361 | +27.2% | Mountain |
| San Diego | CA | $350 | +12.7% | Coastal/Urban |
| Gatlinburg | TN | $337 | +25.4% | Mountain |
| Nashville | TN | $335 | +29.3% | Urban |
| Panama City Beach | FL | $315 | +44.0% | Beach |
| Fort Pierce | FL | $305 | +15.6% | Beach |
| Saint Augustine | FL | $301 | +13.0% | Coastal/Historic |
| Julian | CA | $300 | -1.4% | Mountain/Rural |
| Panama City | FL | $285 | +39.1% | Beach |
| Austin | TX | $283 | +14.4% | Urban |
| Las Vegas | NV | $281 | +16.0% | Urban/Gaming |
| Daytona Beach | FL | $266 | +6.6% | Beach |
| Traverse City | MI | $261 | +42.3% | Lake/Wine Country |
| Orlando | FL | $253 | +22.8% | Family/Resort |
| Asheville | NC | $244 | +20.1% | Mountain |
| Branson | MO | $228 | +36.0% | Entertainment |
| Dallas | TX | $220 | +11.7% | Urban |
| Houston | TX | $217 | +30.0% | Urban |
| San Antonio | TX | $217 | +26.8% | Urban |
| Myrtle Beach | SC | $213 | +58.3% | Beach |
| Denver | CO | $210 | +16.7% | Urban |
| Cumming | GA | $197 | -23.4% | Suburban |
| Silver City | NM | $131 | +10.8% | Rural |
| Source: StaySTRA database (airroi_market_metrics_all), February 2026. Year-over-year comparison vs. February 2025. | ||||
Three markets in this dataset posted negative year-over-year ADR: Cumming, Georgia (-23.4%), Big Bear Lake, California (-2.4%), and Julian, California (-1.4%). Everything else was flat to strongly positive. That is not a market in broad correction. That is a market that normalized after a supply surge and resumed growth.
Mountain and Premium Markets: Where ADR Never Really Corrected
The most striking pattern in the data is how well supply-constrained markets held their pricing through the correction period and how far they have run since.
Park City is the headline case. The Park City STR market is structurally restricted. The city limits new short-term rental licenses, particularly in residential zones. When the wave of new hosts entered the market in 2022 and 2023, Park City’s permitted operator count did not grow proportionally. That constrained supply kept ADR high while less-regulated markets softened.
The same logic applies to Key West. The Key West STR market is bounded by geography. An island cannot meaningfully add housing inventory in response to demand signals. Key West’s $903 ADR in February 2026, up 17% year over year, reflects a market where the pricing floor is set by the physical reality of what it sits on.
Scottsdale, South Lake Tahoe, and Mammoth Lakes follow a related pattern. All three have meaningful regulatory or geographic limits on competing supply. All three show positive year-over-year ADR growth ranging from 8% to 23%.
Think of ADR like water pressure in a pipe. High pressure requires a constrained flow line paired with strong demand. Anywhere you can loosen the supply end of that line, the pressure drops. Markets with constrained supply hold pressure better, and the data bears that out across a multi-year cycle. For investors watching the DSCR math, these ADR figures reshape the underwriting equation from the ground up.
Sponsored — Beeline
Finance Your Next STR With a DSCR Loan
Qualify on property cash flow, not W-2 income. Beeline specializes in fast DSCR closings for STR investors. No personal income verification required.
Check Your DSCR Eligibility →Affiliate disclosure: StaySTRA may earn a referral fee.
Beach and Coastal Markets: The Recovery That Got Less Coverage Than the Bust
The Gulf Coast and Southeast beach markets were some of the most volatile in the dataset. They were among the biggest gainers in 2021 to 2022, among the bigger losers in 2023, and now back to being among the bigger gainers in 2025 to 2026.
Myrtle Beach illustrates the swing. In July 2022 (peak summer season), Myrtle Beach ADR was $227. By July 2025, that had climbed to $322, up 41.6% over three years. The February year-over-year gain of 58.3% partly reflects how soft that market was in early 2025, but the summer trajectory is the more relevant signal for investors: sustained ADR growth well above the 2022 peak level.
Gulf Shores and Orange Beach, Alabama track a similar trajectory. Gulf Shores summer ADR: $337 in July 2022, $475 in July 2025, up 40.8%. Orange Beach: $343 in July 2022, $498 in July 2025, up 45.1%. These are not markets in corrective territory. These are beach communities with strong summer demand and limited competing inventory farther along the Gulf shoreline.
Not every beach market follows this pattern. Destin posted more modest summer gains, $475 in July 2022 to $537 in July 2025, about 13% over three years. Destin carries higher supply density in its core vacation rental corridors than Gulf Shores does. Higher density limits pricing power even when demand is strong.
The lesson for investors: “beach market” is a category, not a uniform condition. A supply-constrained beach community can hold and grow ADR the same way a mountain resort can. A supply-saturated one competes on price and caps upside accordingly. The full beach vs. mountain vs. lake market comparison goes deeper on this with data across 50 markets.
Urban Markets: Steady Recovery, Less Drama
Urban and urban-adjacent markets show a different pattern in the dataset: less volatility in either direction, more consistent recovery, and ADR that reflects broader economic conditions rather than supply-constrained peaks.
Nashville at $335 ADR in February 2026, up 29.3% year over year, is the standout urban recovery story. Nashville’s STR ecosystem draws heavily from bachelorette travel, concerts, and convention overflow, which kept demand relatively resilient during the correction period even as supply grew.
New Orleans at $472 is high in absolute terms but posted more modest year-over-year growth at 7.5%. Charleston at $440 shows strong growth at 28.9%. Miami at $324, up 12%, reflects a market where 2025 World Cup demand set a relatively elevated comparison base for 2026 figures.
Austin draws the most investor attention and probably the most concern in this category. At $283 ADR in February 2026, up 14.4% year over year, Austin is recovering but carries the weight of substantial supply growth from the 2021 to 2022 boom. The market added listings aggressively during that period, and ADR has not returned to its prior relative position among urban markets. Don’t let that put you off the market entirely, but do look at the supply density numbers before you commit.
For investors comparing urban Texas markets, San Antonio at $217 and Houston at $217 show stronger year-over-year growth rates (26.8% and 30% respectively) off a lower ADR base. For the full occupancy picture alongside these ADR figures, see the Airbnb occupancy rate breakdown by city for 2026.
Sponsored — Beeline
Finance Your Next STR With a DSCR Loan
Qualify on property cash flow, not W-2 income. Beeline specializes in fast DSCR closings for STR investors. No personal income verification required.
Check Your DSCR Eligibility →Affiliate disclosure: StaySTRA may earn a referral fee.
What the July 4th 2026 Data Says About the Summer Ahead
Key Data’s July 4th 2026 short-term rental performance report is the most current summer benchmark available. The analysis aligned the July 3 to 6, 2026 holiday weekend against the equivalent days in 2025 (July 4 to 7), controlling for day-of-week patterns to produce a clean year-over-year comparison across 25 U.S. markets.
National figures: ADR up 5.5%, occupancy up 6.5%, RevPAR up 12.4%. When ADR and occupancy both rise, RevPAR improves faster than either input alone. A 12.4% RevPAR gain is a meaningful step up for operators entering the back half of summer.
Regional highlights from the report:
- Midwest: ADR up 11.7%, RevPAR up 29.9%. The strongest regional performance in the entire dataset. Traverse City, Michigan in the StaySTRA database posted ADR of $261 in February 2026, up 42.3% year over year, consistent with this regional strength signal.
- Mid-Atlantic: RevPAR up 26.2%, ADR up 5.6%. Strong demand entering the summer season.
- New England: RevPAR up 18.1%, with travelers booking 14.7% further in advance than in 2025. Earlier booking windows reflect demand confidence, and they give operators more room to hold rates without discounting.
- Osceola County, Florida: ADR up 18.6%, the largest county-level ADR gain in the report. That is the Kissimmee and Disney corridor, where the StaySTRA database already shows February 2026 ADR up 33.1% year over year.
A few markets showed softness. The Hawaiian Islands posted a 3.7% RevPAR decline. Dare County (Outer Banks) was essentially flat. Horry County (Myrtle Beach area) dipped slightly in RevPAR despite Myrtle Beach’s strong year-over-year ADR figures. These are markets with specific supply or booking-cycle dynamics.
Stay with the overall picture: twelve of the fifteen regional and market-level data points in the Key Data report showed positive RevPAR growth. The first major summer benchmark of 2026 is pointing in the right direction.
ADR and the DSCR Equation: Why This Number Is the One That Matters Most
For investors financing short-term rental purchases through DSCR loans, the ADR conversation becomes very concrete when you look at the underwriting math.
DSCR lenders evaluate the ratio of a property’s projected annual gross rental income to its annual debt service, including principal, interest, taxes, insurance, and HOA fees. Most lenders require a ratio of 1.0 or above to qualify. The best pricing comes at 1.25 and higher.
Here is where market ADR becomes the lever that changes the whole equation. A property in Scottsdale, where ADR runs near $587 and annual occupancy across the StaySTRA dataset typically lands in the 45 to 55% range, can generate $85,000 to $110,000 or more in annual gross revenue depending on property size and management quality. At a purchase price of $600,000 with 25% down and current DSCR loan rates, annual debt service runs approximately $37,000 to $42,000. Even at the conservative end of that revenue range, the DSCR ratio clears 2.0. That is a clean approval with room to negotiate pricing.
Now take a market where ADR runs $200 at 40% occupancy. Annual gross revenue: around $29,000. The same debt service structure on a $400,000 property produces a DSCR ratio at or below 1.0. You are fighting for approval, and you will not get preferred pricing even if you get it.
The conclusion is not subtle: higher ADR markets allow you to finance more expensive properties and still produce stronger DSCR ratios than lower ADR markets at cheaper entry prices. For investors who want to use leverage efficiently, market ADR selection is not background context. It is the primary decision variable.
Use the StaySTRA Analyzer to run DSCR projections for any market in the table above. Enter a purchase price, down payment, and loan rate, and the tool pulls StaySTRA market data to project revenue, debt service, and DSCR ratio in real time.
Sponsored — Beeline
Finance Your Next STR With a DSCR Loan
Qualify on property cash flow, not W-2 income. Beeline specializes in fast DSCR closings for STR investors. No personal income verification required.
Check Your DSCR Eligibility →Affiliate disclosure: StaySTRA may earn a referral fee.
Frequently Asked Questions
Is Airbnb average daily rate going up or down in 2026?
Broadly up. Key Data’s July 4th 2026 performance report showed national STR ADR up 5.5% year over year for the holiday weekend. In the StaySTRA dataset covering more than 50 markets, all but 3 showed positive year-over-year ADR changes from February 2025 to February 2026. The strongest gains were in Gulf Coast beach markets (Myrtle Beach up 58.3%, Gulf Shores up 40.5%) and the Midwest. Three markets showed modest declines, all driven by local supply dynamics rather than broad market conditions.
Which STR markets have the highest average daily rates in 2026?
Per StaySTRA data for early 2026, the top ADR markets are Park City, UT ($985), Key West, FL ($903), South Lake Tahoe, CA ($610), Scottsdale, AZ ($587), and Mammoth Lakes, CA ($583). These markets share two characteristics: constrained supply (geographic limits, permit caps, or both) and premium demand from high-income leisure travelers. That combination is what produces durable pricing power across market cycles.
Did STR average daily rates actually drop from the 2022 peak?
For some markets and some seasons, yes. Park City’s summer ADR (July) dropped about 25% from July 2022 to July 2025, reflecting a shift in seasonal demand composition at that resort. Urban markets like Austin saw modest ADR compression relative to the 2022 run-up. But many beach and coastal markets now run well above their 2022 comparable-period ADR levels, and mountain markets with winter-dominant demand are far above 2022 winter comparisons. The broad ADR correction narrative describes a real but narrower phenomenon than the headlines implied.
How does Airbnb ADR affect DSCR loan qualification?
DSCR lenders divide projected annual gross rental income by annual debt service to calculate the DSCR ratio. Higher ADR markets produce higher gross income at similar occupancy rates, which creates better DSCR ratios at higher purchase prices. Investors targeting a 1.25 or better DSCR ratio will find that markets with $350 or higher ADR give significantly more flexibility on purchase price than markets in the $150 to $250 ADR range. The StaySTRA Analyzer models this calculation for any market in the database.
What does the summer 2026 STR ADR data show so far?
The Key Data July 4th 2026 report is the first major summer data point of the season and it is broadly positive. National ADR was up 5.5% year over year, occupancy up 6.5%, RevPAR up 12.4%. The Midwest posted the strongest regional gain at 29.9% RevPAR growth. New England travelers are booking 14.7% further in advance than in 2025, which signals stronger demand confidence. Only three of the fifteen regional and county-level data points in the report showed RevPAR declines, and all three were modest.
We do our best to keep our data accurate and up to date, but markets move fast and we are only human. Always verify current figures directly with local sources before making investment decisions.



