Key Takeaways
- Steamboat Springs has 3,747 active STR listings with a last-twelve-month ADR of $392 and 54.6% occupancy, generating an average of $4,554 per month per property.
- The ski season (January through March) accounts for roughly 62% of total annual STR revenue, with February hitting 91.3% occupancy and $11,790 in monthly revenue per listing.
- At a typical home value near $1.1 million and median STR revenue around $54,648 per year, gross yields sit near 5%, making DSCR qualification difficult without a larger down payment or top-quartile performance.
- Steamboat’s supply is six times larger than Telluride’s (3,747 vs. 608 listings) at roughly half the entry price, offering a more accessible mountain market with stronger occupancy but lower nightly rates.
- A voter-approved 9% STR tax and a three-zone licensing overlay add regulatory complexity that investors must factor into acquisition models before closing.
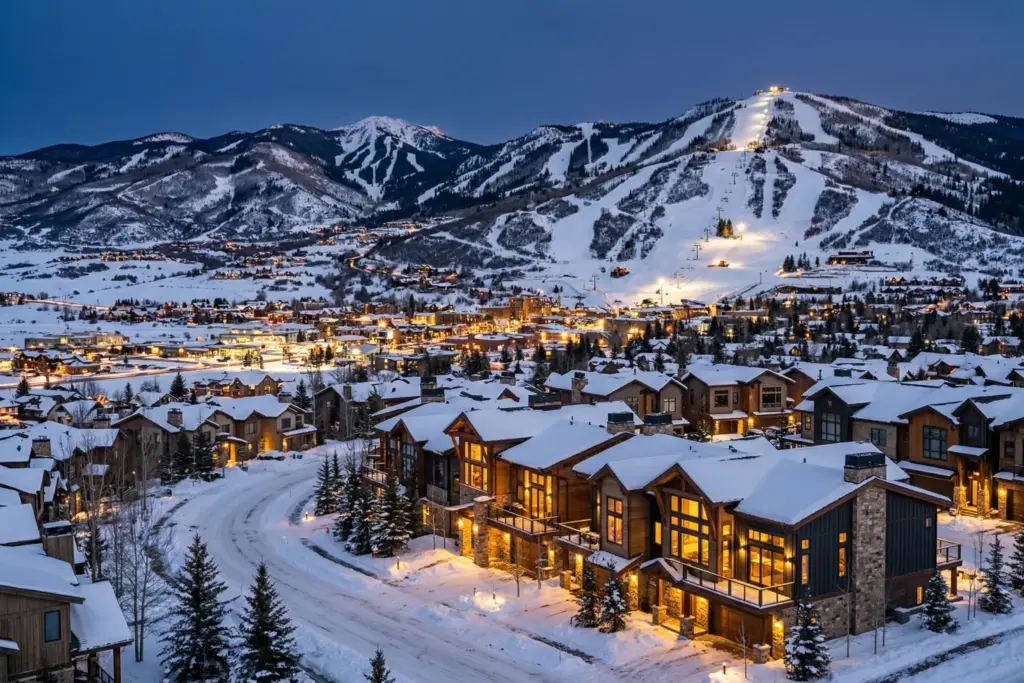
Steamboat Springs posted a last-twelve-month average daily rate of $392 across 3,747 active short-term rental listings, according to StaySTRA data. Think of that number as the market’s sticker price, the rate guests are actually willing to pay for a night in this particular slice of the Rockies. And at 54.6% annual occupancy, those listings are filling more than half their available nights, a strong signal for a mountain market that shuts down almost entirely between mid-April and late May.
I have been watching Colorado’s mountain STR corridor for the better part of four decades, first as a government statistician chasing census data across the Western Slope, and now as a market analyst with a cup of black coffee and a spreadsheet that never seems to close. Steamboat Springs keeps showing up in investor conversations for a reason. It sits in a different lane than Telluride or Aspen. The entry price is lower. The supply is deeper. And the shoulder seasons, particularly summer, carry more weight here than in most Colorado ski towns.
This is what the numbers actually look like for investors considering a Steamboat Springs STR acquisition in 2026.
Steamboat Springs STR Market Snapshot
Before we get into the seasonal story, here is the full market overview. StaySTRA tracks 3,747 active short-term rental listings in Steamboat Springs as of spring 2026.
| Metric | Steamboat Springs | Telluride (comparison) |
|---|---|---|
| Active STR Listings | 3,747 | 608 |
| LTM Average Daily Rate | $392 | $663 |
| LTM Occupancy Rate | 54.6% | 37.5% |
| LTM Avg Monthly Revenue | $4,554 | $5,198 |
| Estimated Annual Revenue | $54,648 | $62,379 |
| Typical Home Value | ~$1,100,000 | ~$2,257,000 |
| Gross Yield (median) | ~5.0% | ~2.8% |
| Peak Month | February ($11,790) | February ($11,223) |
Two things jump out of that table. First, Steamboat’s ADR is 41% lower than Telluride’s, but its occupancy rate is 17 percentage points higher. More nights booked at a lower rate produces remarkably similar monthly revenue. Second, and this is the number that matters for acquisition math, Steamboat’s gross yield is nearly double Telluride’s. A property that costs half as much and earns almost as much changes the entire investor calculus.
The Seasonal Revenue Story
Every mountain market has a seasonal rhythm. Steamboat’s rhythm is more pronounced than most. Stay with me through the monthly data, because the spread between peak and trough tells you exactly how this market behaves.
| Month | ADR | Occupancy | Monthly Revenue |
|---|---|---|---|
| January | $553 | 77.4% | $10,072 |
| February | $604 | 91.3% | $11,790 |
| March | $561 | 86.4% | $11,747 |
| December | $483 | 41.9% | $5,357 |
| July | $322 | 58.1% | $4,427 |
| August | $322 | 47.6% | $3,694 |
| June | $330 | 40.0% | $3,164 |
| September | $295 | 37.9% | $2,791 |
| October | $282 | 32.3% | $2,230 |
| November | $300 | 25.0% | $1,986 |
| April | $320 | 23.3% | $2,054 |
| May | $286 | 19.4% | $1,529 |
Ski Season (December through March)
The ski season is the engine. January through March alone generated $33,609 in average revenue per listing, which is roughly 62% of the entire annual total packed into three months. February is the crown jewel: 91.3% occupancy with a $604 ADR. That is nearly every night booked at rates that approach luxury hotel pricing.
December sits a step below, starting strong around the holidays but showing softer demand in early December before the resort hits its stride. Still, $5,357 in monthly revenue makes it a solid contributor.
Summer (June through August)
Here is where Steamboat separates from some of its Colorado peers. Summer is not an afterthought here. Steamboat calls itself “Bike Town USA,” and the numbers reflect it. July posts 58.1% occupancy at a $322 ADR, producing $4,427 in monthly revenue. That is not ski season money, but it is real revenue that keeps properties producing through months when some mountain markets go nearly dark.
Think of it like this: if ski season is your salary, summer is your side income. Not enough to live on alone, but enough to shift the annual picture from challenging to workable. June through August combined produce roughly $11,285, about 21% of annual revenue.
Shoulder Seasons (April, May, September through November)
Don’t let these months scare you. They are weak, yes. May’s 19.4% occupancy is the lowest point on the calendar, and the $1,529 in monthly revenue barely covers a cleaning fee and utilities. But experienced operators in this market know the shoulder months are where pricing strategy separates profitable portfolios from struggling ones.
September and October draw fall foliage visitors and early hunting season guests. The numbers are modest ($2,791 and $2,230 respectively), but they are not zero. November builds slowly toward ski season. The combined shoulder months produce about $10,590, or 19% of annual revenue.
Property Mix and Supply Composition
Steamboat’s 3,747 active listings skew heavily toward two-bedroom units, which account for 1,178 properties (31% of supply). Here is the full breakdown:
| Configuration | Listings | Share of Supply |
|---|---|---|
| Studio | 104 | 2.8% |
| 1-Bedroom | 558 | 14.9% |
| 2-Bedroom | 1,178 | 31.4% |
| 3-Bedroom | 616 | 16.4% |
| 4-Bedroom | 449 | 12.0% |
| 5+ Bedroom | 214 | 5.7% |
That concentration in the one-to-three-bedroom range tells you something about the market’s character. Steamboat is not primarily a luxury estate market like Telluride. It is a condo and townhome market. Ski-in/ski-out condos near the base area dominate supply, and that shapes both the pricing ceiling and the investor entry point.
The 4-bedroom and 5+ bedroom segments (663 listings combined, about 18% of supply) command premium rates during ski season but face steeper competition in shoulder months when group travel drops off. If you are evaluating an acquisition, the two-to-three-bedroom sweet spot offers the most consistent year-round demand.
Booking Windows and Advance Demand
How far in advance guests book tells you a lot about a market’s demand profile. StaySTRA data shows Steamboat’s booking window activity:
- 1 to 3 months ahead: 68.3% booked
- 4 to 6 months ahead: 63.4% booked
- 7 to 9 months ahead: 28.1% booked
- 10 to 12 months ahead: 5.4% booked
That 63.4% booking rate at the 4-to-6-month window is notably strong. It means guests are locking in ski season stays during summer and early fall, which gives operators revenue visibility well in advance. If you are running dynamic pricing tools, this pattern supports raising rates earlier in the booking cycle for peak months rather than waiting for last-minute demand.
The Acquisition Math
Now for the part that separates browsing from buying. Let me walk through the investment calculus as clearly as I can.
Steamboat Springs home values currently sit near $1.1 million (Zillow typical home value: $1,138,145; Redfin January 2026 median sale: $972,000). The spread between those numbers reflects different measurement methods, but for investment modeling, plan on a range of $975,000 to $1.15 million for a typical STR-capable property.
At the median annual STR revenue of $54,648 and a typical home value of $1.1 million, the gross yield lands near 5.0%. After estimated operating expenses of 30% (management, cleaning, maintenance, supplies, insurance), net operating income drops to approximately $38,254.
For DSCR loan qualification at 80% LTV and current rates near 7.5%, the annual debt service on an $880,000 mortgage runs approximately $73,800. That puts the DSCR ratio at roughly 0.52, well below the 1.0 minimum most lenders require.
Don’t let that number end the conversation. Here is the reality: median revenue includes every studio condo and every poorly optimized listing in the market. Top-quartile operators running well-positioned three-bedroom properties with professional management and aggressive dynamic pricing are generating $75,000 to $80,000 or more annually. At $78,000 in gross revenue and the same cost assumptions, net operating income rises to about $54,600, and the DSCR ratio improves to roughly 0.74. Still below 1.0 at 80% LTV, but at a 40% down payment, the math starts to work.
The takeaway: Steamboat Springs is not a market where you can put 20% down on a median-priced property and expect the rental income to cover the mortgage from day one. It rewards investors who bring more equity, buy the right property type, and operate at above-average performance levels. For a deeper look at which markets pencil out at different leverage levels, see our analysis of the best STR markets for DSCR borrowers in 2026.
Regulatory Landscape
Steamboat Springs has built one of the more structured STR regulatory frameworks among Colorado mountain towns. If you are buying here, understanding the rules is not optional.
The city requires an annual short-term rental license for any property rented for fewer than 30 consecutive nights. Operating without a license is a violation of city ordinance. The licensing system operates within a three-zone overlay:
- Zone A: No cap on STR licenses. This zone covers much of the resort base area and commercial corridors.
- Zone B: Capped licenses with limits set across six subzones. Once a subzone reaches its cap, new licenses are not issued until existing ones are surrendered or expire.
- Zone C: Non-hosted STRs are prohibited. Only hosted rentals (one guest room, maximum 400 square feet) and temporary rentals (2 occurrences, 30 cumulative days per year) are allowed.
In November 2022, Steamboat voters approved a 9% tax on short-term rentals, collected on top of existing state and local lodging taxes. That additional tax burden is significant and must be factored into any revenue projection. For investors comparing across Colorado markets, our Colorado STR laws guide for 2026 breaks down the regulatory differences market by market.
Occupancy limits are based on square footage: one guest per 150 square feet of net floor area, with a minimum of two and a maximum of 16 occupants. This cap can affect revenue potential for larger properties that might otherwise accommodate bigger groups.
Steamboat vs. the Mountain Market Peers
Context matters. Numbers mean more when you can see where a market sits relative to its peers. Here is how Steamboat compares to the other mountain markets we have analyzed in this series.
| Metric | Steamboat Springs | Telluride | Jackson Hole | Big Sky |
|---|---|---|---|---|
| Active Listings | 3,747 | 608 | 1,267 | 1,892 |
| LTM ADR | $392 | $663 | $589 | $594 |
| Occupancy | 54.6% | 37.5% | 46.9% | 56.0% |
| Est. Annual Revenue | $54,648 | $62,379 | $78,821 | $125,000 |
| Typical Home Value | ~$1.1M | ~$2.26M | ~$1.8M | ~$1.5M |
| Gross Yield | ~5.0% | ~2.8% | ~4.4% | ~8.3% |
Steamboat offers the lowest entry price and the highest occupancy of the four mountain markets. Its ADR is also the lowest, which pulls annual revenue below Jackson Hole and Big Sky. But gross yield is the number that matters most for acquisition decisions, and at 5.0%, Steamboat sits comfortably above Telluride and slightly above Jackson Hole.
For investors who have been watching the Jackson Hole STR market or the Big Sky market, Steamboat represents a different risk profile: lower ceiling but lower entry cost and more forgiving occupancy patterns.
Who Should Be Looking at Steamboat Springs
Every market has an investor profile it rewards. Steamboat fits a specific one.
This market works best for investors who can bring 30% to 40% down, who plan to hold long-term, and who treat the STR income as a way to offset carrying costs rather than as pure cash flow from day one. The appreciation story in Routt County has been strong (Zillow shows consistent year-over-year gains), and the combination of rental income plus equity growth is the real return narrative.
It also works for investors who value operational simplicity. The condo-heavy supply means lower maintenance burden compared to single-family mountain homes. A well-managed two-bedroom condo near the resort base can produce consistent ski season revenue without the complexity of managing a large standalone property.
This market is less suited for investors seeking immediate cash-on-cash returns at high leverage, or for anyone who has not accounted for the 9% STR tax and the licensing zone restrictions. Buying in Zone B without confirming license availability would be a costly mistake.
We do our best to keep our data accurate and up to date, but markets move fast and we are only human. Always verify current figures directly with local sources before making investment decisions.
Frequently Asked Questions
What is the average STR revenue in Steamboat Springs in 2026?
StaySTRA data shows the average Steamboat Springs short-term rental generates approximately $4,554 per month, or about $54,648 annually. Top-performing properties with professional management and dynamic pricing can exceed $75,000 to $80,000 per year. Revenue is heavily concentrated in the January through March ski season, which accounts for roughly 62% of annual income.
How does Steamboat Springs compare to Telluride for STR investment?
Steamboat has six times more listings (3,747 vs. 608), a 41% lower ADR ($392 vs. $663), but 17 percentage points higher occupancy (54.6% vs. 37.5%). The typical home value in Steamboat is roughly half of Telluride’s ($1.1M vs. $2.26M), which translates to a significantly better gross yield of approximately 5.0% compared to Telluride’s 2.8%. Steamboat is the more accessible entry point with stronger occupancy, while Telluride commands ultra-premium nightly rates.
Do you need a license to operate a short-term rental in Steamboat Springs?
Yes. The City of Steamboat Springs requires an annual license for any rental of fewer than 30 consecutive nights. The city uses a three-zone overlay system. Zone A has no cap on licenses, Zone B has capped licenses by subzone, and Zone C prohibits non-hosted STRs entirely. Operating without a license is a violation of city ordinance. Voters also approved a 9% STR-specific tax in November 2022.
What is the best season for Steamboat Springs Airbnb revenue?
The ski season from January through March is by far the strongest period. February leads with 91.3% occupancy, a $604 ADR, and $11,790 in average monthly revenue. Summer (June through August) provides a secondary revenue peak, particularly July at 58.1% occupancy. The weakest months are April and May, when the resort transitions between ski and summer seasons.
Can a Steamboat Springs STR cover its mortgage with rental income?
At median revenue levels ($54,648/year) and a conventional 80% LTV mortgage at current rates, the debt service coverage ratio falls below 1.0, meaning rental income alone does not cover the mortgage payment. Investors who bring 35% to 40% down and operate at top-quartile revenue levels ($75,000 or more annually) can approach or exceed breakeven. Steamboat rewards equity-heavy, long-term investors rather than highly leveraged cash flow strategies.
Run the Numbers on Steamboat Springs
The data in this article gives you the market-level picture. To see what a specific property could generate, run an address through the StaySTRA Steamboat Springs Airbnb Calculator. It pulls from the same dataset powering this analysis and gives you property-level revenue estimates, occupancy projections, and comparable rental data.
For the full Steamboat Springs market dashboard with interactive data, visit the StaySTRA Steamboat Springs market page.
Become a StaySTRA Insider
Join free — get our newsletter + 1 free property analysis/month.
No spam. Unsubscribe anytime. Free membership includes property analyses and market insights.


