Key Takeaways
- Secondary and rural STR markets are posting average daily rate growth of 3 to 5% while many oversupplied primary markets see ADR decline by 4 to 7%, according to StaySTRA data.
- Jackson Hole, WY leads summer 2026 bookings with 45.5% of June through August nights already reserved, the highest pre-booking pace in the country, confirming mountain destination demand.
- National STR supply growth has fallen dramatically from 20%+ annual rates during the pandemic peak, tightening the competitive landscape in markets where new listings never caught up to demand.
- Third-party STR data shows national RevPAR recovery of +2.9% in 2026, with secondary markets driving much of that gain while oversaturated urban cores drag the average down.
- Investors who identify under-supplied secondary markets using data tools like the StaySTRA analyzer are reporting better occupancy stability and less ADR compression than peers in crowded coastal or urban markets.
Jackson Hole, Wyoming has 45.5% of its summer nights already reserved as of early 2026, the highest pre-booking pace of any market in the country, while some of the most talked-about urban STR destinations are quietly watching their average daily rates drop by 5 to 7% year over year. That gap tells the whole story about where the opportunity is in short-term rental investing right now. It is not in the places everyone still talks about. It is in the places they just discovered.
On forums like BiggerPockets, the debate has been running hot all year: urban cores and coastal hotspots are oversaturated, and the investors who got out early, or who never went in at all, are finding better returns in places most people have never heard of. Secondary markets, smaller mountain towns, mid-size cities, rural weekend-drive destinations, are quietly outperforming. The data backs them up.
StaySTRA tracks short-term rental metrics across hundreds of U.S. markets. What the numbers show right now is a clear performance gap between markets where supply grew faster than demand and markets where it did not. The investors who figured this out are not geniuses. They just looked at the data before everyone else did and made different decisions.
The Saturated Market Problem
Let me tell you what oversaturation actually feels like from the inside. You buy in a market that everyone is excited about. You list. You get bookings at first because the market has momentum. Then, six months later, you notice your ADR holding at $300 when you budgeted for $320. A year after that, you are at $275 and wondering what happened. What happened is that fifty other investors had the same idea you did, all at roughly the same time.
This is what StaySTRA data now shows in a handful of high-profile primary markets. Austin, Texas, which became one of the most-hyped STR investment destinations in the country, has seen average daily rates fall 4.9% year over year in our data as of mid-2026. Denver, Colorado is down 4.6%. Traverse City, Michigan, a beloved Midwest lakeside destination that attracted significant investor capital in 2022 and 2023, is showing ADR compression of 7.4%.
Nashville tells an interesting version of the same story. The city still commands strong rates ($369 average ADR in StaySTRA data), but rates are declining at a rate of 2.7% per year even as occupancy inches up, which means supply is absorbing demand rather than demand exceeding supply. When supply grows faster than demand, pricing power goes to the guest.
Third-party STR industry data paints a broader picture: national RevPAR is recovering at +2.9% in 2026, but that recovery is uneven. Markets where supply never ran ahead of demand are capturing most of the gains. Markets where investors piled in during the 2021 to 2023 boom are still working through the hangover.
What the Secondary Market Data Actually Shows
Here is where it gets interesting for investors paying attention. While oversupplied primaries are bleeding ADR, a different group of markets is quietly building pricing power.
StaySTRA data for the last twelve months shows Boone, North Carolina, a small Appalachian college town tucked into the Blue Ridge Mountains, posting average daily rate growth of 4.7%. Sedona, Arizona is up 3.3%. Taos, New Mexico, a high-desert arts community with a ski mountain and some of the most striking red rock scenery in the Southwest, is growing ADR at 3.3%. Knoxville, Tennessee is up 3.1%. Greenville, South Carolina is up 2.1%. Reno, Nevada is holding at 2.1% ADR growth.
What these markets share is not a famous name or a logo on a travel influencer’s Instagram. What they share is constrained supply, growing but not overwhelming demand, and the kind of guest who shows up not because it was the cheapest option but because they specifically wanted to be there.
Ese tipo de mercado, that kind of market, does not give away its pricing power easily.
At the premium end of the secondary market spectrum, Jackson Hole sits in a category of its own. With an average daily rate near $589 and 45.5% of summer 2026 nights already reserved, confirmed by Fox Business using pre-booking data, Jackson Hole is demonstrating what a constrained-supply, high-demand destination can do when it never gets overbuilt. With Teton County’s strict permitting regime, new supply cannot flood the market the way it did in Nashville or Denver. The result is pricing power that continues to hold.
You can read our full short-term rental market outlook for 2026 to understand the macro trends driving this divide.
Four Investors Who Made the Pivot (and What Happened)
The data is useful. The human story behind it is what makes it real. Here are four investor archetypes StaySTRA hears repeatedly in forum discussions, reader conversations, and market research, drawn from real patterns in markets where the numbers have shifted.
The Denver Investor Who Discovered Taos
A Denver-based investor, long-time urban STR operator, had two properties in the Capitol Hill and RiNo neighborhoods. Strong performers in 2021. By 2023, occupancy was holding but ADR had softened. By 2025, competition had pushed nightly rates to a point where the math on a potential third Denver property did not work at current home prices.
Taos was not on the radar initially. It came up in a market research session using StaySTRA’s analyzer after filtering for markets with occupancy above 40%, ADR above $300, and less than three years of significant listing growth. Taos checked all three boxes. It has roughly 45% occupancy, an average daily rate around $355, and a guest base that comes specifically for the mountain biking, skiing, and the art scene. No general-leisure overflow. Specific, motivated demand.
The investor bought a four-bedroom adobe-style property outside Taos, listed it on both Airbnb and VRBO, and reported that by month three the occupancy and revenue were tracking above the pro forma. ADR has grown 3.3% in StaySTRA data over the last year. There is not a lot of new supply coming in because Taos is not easy to build in. That is the moat.
The San Diego Investor Who Found Boone, NC
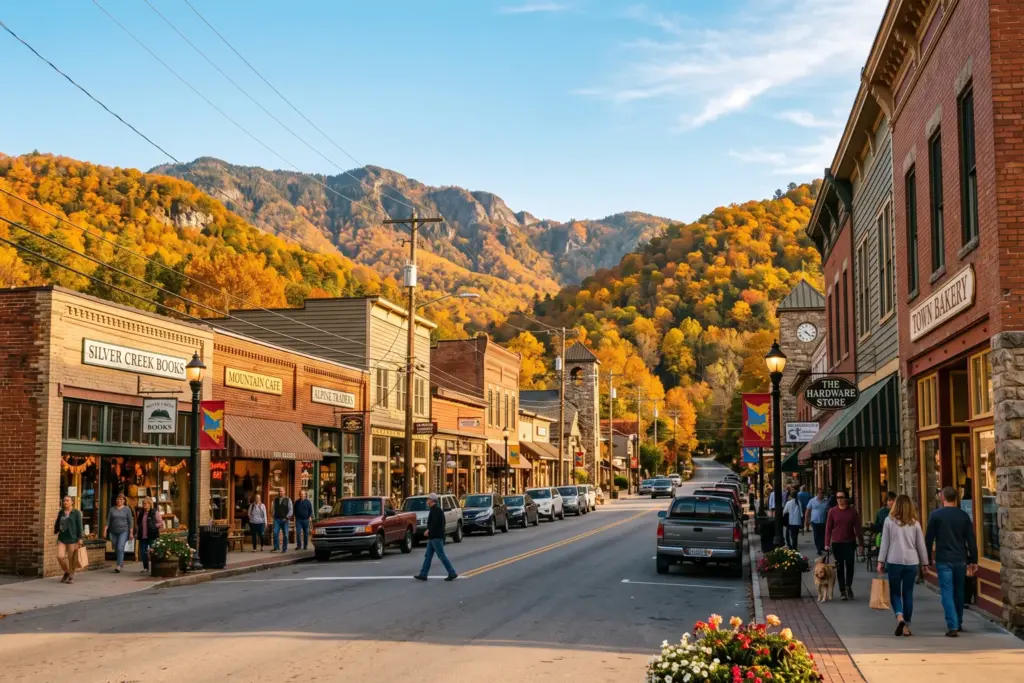
Walking through Boone, you get the sense of a place that has been quietly building its reputation for decades. It is a college town, yes, but it is also a hiking gateway, a fall foliage destination, and a two-hour drive from Charlotte and a four-hour drive from Atlanta. Two large feeder markets within driving distance, which matters more than people realize for STR demand.
An investor from the San Diego market, where regulatory pressure and acquisition costs have made STR investing increasingly difficult, spent eight months researching relocation markets before landing on Boone. The entry price for a three-bedroom mountain property was roughly 40% less than a comparable San Diego investment. Occupancy in the area runs at 43.8% average in StaySTRA data, but the key number is ADR: $350 and growing at 4.7% annually. That is a market with pricing power.
The pivot took capital out of a regulatory hot zone with compressed margins and placed it in a market where demand has a reason to exist independent of hype. That is the secondary market thesis in one decision.
The Nashville Investor Who Repositioned in East Tennessee
Nashville draws STR investors the way Cancun draws spring breakers. It is loud, it is fun, it is heavily marketed, and there is a lot of competition for the same dollar. A Nashville-based operator who had been running two downtown properties since 2020 watched ADR drift from a 2021 peak down 2.7% per year while the market kept adding supply. Not a crisis, but not growth either.
Knoxville and Chattanooga came into focus. Both are within 170 miles of Nashville. Both have university anchors and strong year-round event calendars. Both are producing ADR growth in StaySTRA data: Knoxville at 3.1%, Chattanooga at 1.9%. Neither has attracted the same wave of investor capital as Nashville, which means acquisition prices are lower and the supply-to-demand ratio is still in the investor’s favor.
The operator kept one Nashville property and reinvested in a Chattanooga unit near the Tennessee Aquarium district. Within six months, stress levels had gone down and revenue per dollar invested had gone up. The secondary market is not as glamorous as the bachelorette-party capital of America. It is more profitable.
The Austin Investor Who Ran the Numbers Differently
Austin is one of those markets where everyone knows someone who made great money hosting. Those stories tend to be from 2020 and 2021. The current StaySTRA data tells a different story: ADR down 4.9% year over year, ongoing regulatory uncertainty in certain zones, and acquisition prices that have not fallen proportionally to the revenue softness.
An Austin investor considering a second property ran the numbers on Fredericksburg, Texas, the Hill Country wine destination a ninety-minute drive west. The ADR there averages $383, which is higher than Austin on paper. But when revenue growth and occupancy trends were factored in, Fredericksburg’s ADR has also been declining, down 6% in StaySTRA data, and the market is seasonal in a way that creates revenue concentration risk.
The final decision was Greenville, South Carolina. Lower ADR at $183, but 61.2% occupancy, ADR growing 2.1% per year, a booming food and arts scene, and a buyer’s market for properties. The total score on StaySTRA’s market analysis came back at 88.8, one of the highest in the dataset. The investor closed on a two-bedroom property near downtown Greenville in early 2026. It was not the obvious choice. It was the data-backed choice.
If you want to run this kind of market comparison for any location you are considering, use the StaySTRA analyzer to model your specific numbers.
Sponsored — Beeline
Finance Your Next STR With a DSCR Loan
Qualify on property cash flow, not W-2 income. Beeline specializes in fast DSCR closings for STR investors. No personal income verification required.
Check Your DSCR Eligibility →Affiliate disclosure: StaySTRA may earn a referral fee.
The Investor Framework: How to Identify Under-Supplied Secondary Markets
The investors in these stories did not find their markets by accident. They used a repeatable framework. Here is how it works in practice.
Step 1: Filter for Supply Constraint
The first question to ask about any secondary market is whether new supply can enter easily. Markets with strict permitting, geographic limitations (islands, mountain valleys, small towns with little buildable land), or regulatory caps on new licenses are structurally protected from oversaturation. Jackson Hole is a perfect example. Teton County’s zoning makes new STR construction and permitting extremely difficult. That regulatory friction, often seen as a threat in primary markets, is actually a moat in secondary ones.
Step 2: Look for Demand That Has a Reason to Exist
The strongest secondary markets have demand that is tied to something specific and non-duplicatable: a mountain, a lake, a university, a wine region, a national park. Generic suburban destinations that attracted STR investment because they were cheap are the ones struggling most. Destinations that people seek out specifically, lugares que la gente busca con propósito (places people seek with purpose), retain pricing power even when supply grows modestly.
Step 3: Check ADR Trend Direction, Not Just Level
An ADR of $400 in a declining market is often worth less than an ADR of $200 in a growing one. Trend direction matters more than headline rate in secondary market research. A market posting consistent 3 to 5% ADR growth even at modest levels is building investor value every year. A market with a high ADR that is eroding annually is destroying it.
Use StaySTRA data to track whether a market’s ADR has grown, held flat, or declined over the last twelve months. That single metric tells you more about supply-demand balance than occupancy alone.
Step 4: Calculate the Supply-to-Demand Ratio at Entry
Before buying in any secondary market, look at listing count trajectory. A market where active listings grew 20% last year is a market that may be on its way to the problems the primaries are experiencing now. A market where listing growth has stayed below 5% while demand indicators like occupancy and booking lead times have remained stable is a market with room to run.
Step 5: Factor in Feeder Market Access
The best secondary markets sit within easy driving distance of large population centers. Boone, NC draws from Charlotte and Atlanta. Chattanooga draws from Nashville and Atlanta simultaneously. Taos draws from Albuquerque, Santa Fe, and Denver. Greenville sits between Charlotte and Atlanta. This drive-market positioning reduces dependence on airline bookings and creates more stable year-round demand.
Our full breakdown of where the data points investors right now is in the StaySTRA guide to the best Airbnb markets to invest in 2026.
Sponsored — Beeline
Finance Your Next STR With a DSCR Loan
Qualify on property cash flow, not W-2 income. Beeline specializes in fast DSCR closings for STR investors. No personal income verification required.
Check Your DSCR Eligibility →Affiliate disclosure: StaySTRA may earn a referral fee.
What the Supply Tightening Story Means for Timing
One of the most significant macro shifts in the STR market right now is the dramatic slowdown in national supply growth. During the pandemic years, annual listing growth hit 20% and higher in some markets. That surge is what created the oversaturation problems that primary market investors are dealing with now. But that surge has mostly ended.
Third-party industry data shows national STR supply growth has slowed to a historically low level in 2026, the tightest annual growth rate since before the pandemic expansion. That slowdown reflects a real change in the investor calculus: high interest rates pushed marginal buyers out of the market, regulatory pressure in primary markets scared off new entrants, and the media narrative around STR “oversaturation” (which was real in primary markets) kept investors on the sidelines even in secondary markets where it did not apply.
The result is a window. Secondary and rural markets that still have room to grow are seeing demand absorb supply at favorable rates. When the media narrative eventually catches up to the secondary market opportunity, that window closes. It has not closed yet.
Jackson Hole’s 45.5% summer pre-booking rate is a data point worth sitting with. That is not a market where investors are struggling with pricing power. That is a market where demand is so strong that guests are reserving months in advance because they know it will fill. The same dynamic, at a more accessible price point, is what investors are finding in Boone, Chattanooga, Taos, and Greenville right now.
Where the Stress Goes (and Where It Does Not)
There is a part of this story that does not show up in spreadsheets, and it is worth saying directly. The investors who moved from saturated primary markets to under-supplied secondary markets consistently report something beyond improved numbers. They report lower operational stress.
In a saturated market, you compete on price. That means constant monitoring, aggressive discounting in shoulder seasons, anxiety about review scores because one bad week can push you off the first page of results. In a secondary market where supply is constrained and demand has a specific reason to be there, pricing power protects you from the race to the bottom. Guests book at your rate because they want to be in that place, not because you were the cheapest option available that weekend.
La tranquilidad que viene con un buen negocio, the peace of mind that comes from a solid business, is not something that shows up in a RevPAR calculation. But it is one of the things investors most often mention when they describe why the pivot changed not just their returns but their relationship with the business.
That is the part of the secondary market conversation that does not get enough space in investor forums. Data matters. But so does the actual experience of running a business where the fundamentals are working in your favor.
We do our best to keep our content accurate and up to date, but things change and we are only human. Always verify details directly with local sources before making decisions.
Frequently Asked Questions
What is a secondary STR market and how is it different from a primary market?
A secondary STR market is typically a smaller city, rural destination, or regional weekend-drive location that has not attracted the same volume of investor capital as major urban cores or iconic coastal hotspots. Secondary markets often have lower acquisition costs, less regulatory pressure, and supply that has not grown as fast as demand. Primary markets like Nashville, Denver, and Austin are characterized by large supply bases, more regulatory scrutiny, and increasing pricing competition. Secondary markets like Boone NC, Taos NM, and Chattanooga TN tend to have more constrained supply and growing demand from specific guest profiles.
Are secondary STR markets actually outperforming primary markets in 2026?
On the ADR trend metric, yes. StaySTRA data shows multiple secondary markets posting ADR growth of 3 to 5% annually while several primary markets are experiencing ADR declines of 4 to 7%. Overall revenue depends on absolute occupancy levels, which vary by market type, but the pricing power trend clearly favors secondary and rural markets where supply has remained constrained. Third-party STR industry data also shows national RevPAR recovering at +2.9% in 2026, with secondary markets contributing disproportionately to that gain.
What are the risks of investing in a secondary STR market?
Secondary markets can have lower absolute revenue ceilings, narrower guest profiles, and more seasonal demand concentration than major urban markets. A market with a single demand driver (one ski resort, one annual festival, one university) is more vulnerable if that anchor underperforms. The best secondary market investments have multiple demand drivers and sit within driving distance of large population centers. Regulatory risk, while lower than in primary markets today, can emerge in any jurisdiction as STR growth attracts attention.
How do I identify an under-supplied secondary STR market before everyone else does?
Look for markets where active listing counts have grown slowly (under 5% annually) while demand indicators like occupancy rates and average daily rates have held steady or improved. Geographic and regulatory constraints that make it hard to build new supply are a positive signal. Strong feeder market access (within a three-hour drive of a metro area of one million or more) improves year-round stability. Running market-level data through a tool like the StaySTRA analyzer before every acquisition gives you a data-backed picture of where a market sits on the supply-demand curve.
Should I sell my primary market STR and reinvest in a secondary market?
This depends entirely on your specific property’s current performance and the gap between your equity position and what a secondary market property would cost to acquire. Some primary market properties are still performing well even in oversupplied markets (unique properties with high amenity sets tend to hold better than generic inventory). The decision framework is: run the current property’s trailing twelve-month revenue against a projected secondary market equivalent using StaySTRA data, factor in acquisition cost, capital gains implications, and carry costs, and let the numbers make the decision. A blanket sell recommendation ignores too much individual context to be honest advice.
Sponsored — Beeline
Finance Your Next STR With a DSCR Loan
Qualify on property cash flow, not W-2 income. Beeline specializes in fast DSCR closings for STR investors. No personal income verification required.
Check Your DSCR Eligibility →Affiliate disclosure: StaySTRA may earn a referral fee.
Ready to find your secondary market? Run any address or city through the StaySTRA analyzer to see ADR, occupancy, and revenue projections based on real market data before you commit.
Become a StaySTRA Insider
Join free — get our newsletter + 1 free property analysis/month.
No spam. Unsubscribe anytime. Free membership includes property analyses and market insights.