Key Takeaways
- Palm Springs short-term rentals generate a last-twelve-month average daily rate of $463 and 60% occupancy across 6,018 active listings, per StaySTRA data.
- Festival season (Coachella and Stagecoach in April) drives peak monthly revenue above $8,200, nearly triple the September trough of $3,089.
- The city’s new 26-contract annual cap and 20% neighborhood density limit, effective January 2026, restrict new supply without affecting existing permitted properties.
- Typical home values sit at $617,230, and LTM monthly revenue of $5,280 gives investors a concrete baseline for underwriting.
- The nearby Riverside County STR moratorium does not apply to Palm Springs (an incorporated city with its own permit system), but it signals tightening regulatory pressure across the Coachella Valley.
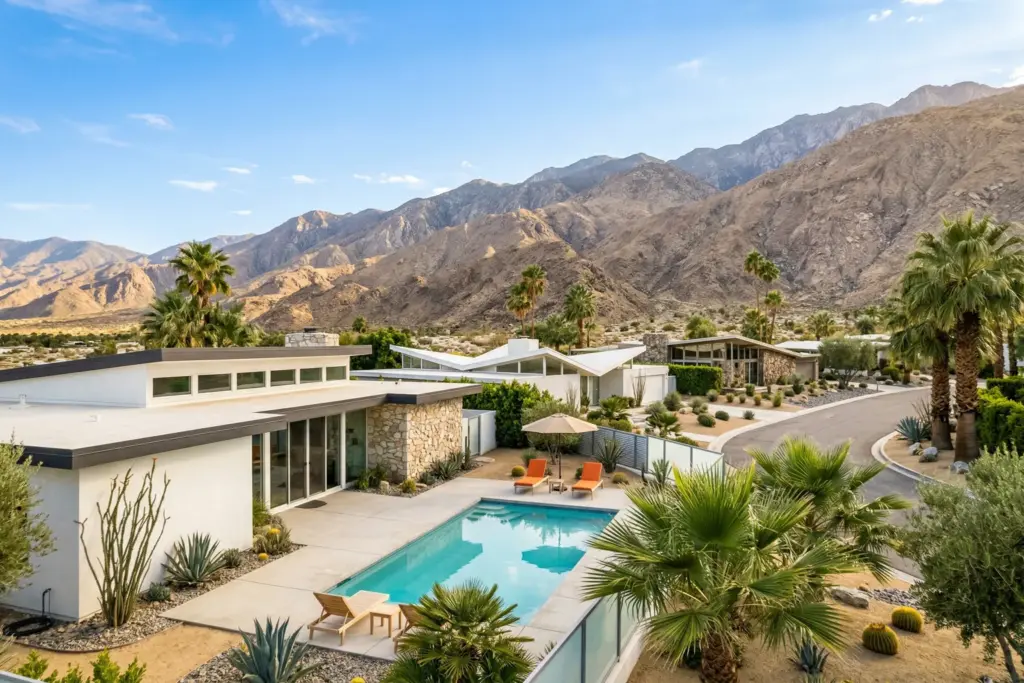
Palm Springs short-term rentals averaged $463 per night over the last twelve months, with occupancy holding at 60% across 6,018 active listings. For a desert market that essentially shuts its windows from June through September, that is a number worth sitting with for a moment. It tells you that when Palm Springs is “on,” it is on in a way that compensates for the quiet months and then some.
I have been tracking seasonal resort markets for the better part of four decades, and the pattern here is one of the cleanest I have seen. The Palm Springs short-term rental market runs like a furnace from January through April, cools steadily through summer, and then reignites in the fall. If you understand that rhythm, you can underwrite it. If you fight it, the numbers will frustrate you.
Let me walk you through what StaySTRA’s data actually shows, month by month, and what it means for investors watching this market in 2026.
Palm Springs STR Revenue by the Numbers
StaySTRA data tracks 6,018 active short-term rental listings in Palm Springs. That is a mature market. For context, listing inventory grew 167% over the past decade, from roughly 2,258 properties in 2016 to today’s count. That growth has slowed considerably as the city’s regulatory framework has tightened (more on that below).
Here are the core performance metrics over the last twelve months:
- Average Daily Rate (LTM): $463
- Occupancy Rate (LTM): 60.0%
- Monthly Revenue (LTM average): $5,280
- RevPAR: $278
- Estimated Annual Revenue: $63,360
Think of that $5,280 monthly average like the sticker price on a car at a dealership. Some months, your actual revenue will come in well above it. Others, well below. The annual average smooths out the seasonal swings, but it does not tell you what any given month will feel like in your bank account. That is where the monthly breakdown earns its keep.
The Seasonal Story: Where the Real Money Lives
Palm Springs is a textbook seasonal market, and the gap between peak and trough is dramatic. Here is how the numbers played out month by month:
Peak Season (January through April):
- January: $451 ADR, 64.5% occupancy, $5,164 revenue
- February: $498 ADR, 81.3% occupancy, $6,413 revenue
- March: $525 ADR, 88.2% occupancy, $8,249 revenue
- April: $574 ADR, 72.0% occupancy, $8,274 revenue
Off-Season (June through September):
- June: $423 ADR, 40.0% occupancy, $3,726 revenue
- July: $421 ADR, 41.9% occupancy, $3,943 revenue
- August: $450 ADR, 35.5% occupancy, $3,605 revenue
- September: $442 ADR, 32.0% occupancy, $3,089 revenue
That peak-to-trough spread is striking. April revenue ($8,274) runs nearly 2.7 times what September brings in ($3,089). Stay with me here, because this is the number that separates investors who succeed in Palm Springs from those who get burned: your property needs to earn enough between January and April to carry you through a summer where occupancy drops below 35%.
The shoulder months tell an interesting story too. October occupancy jumps back to 48.4% as temperatures become bearable again, and November climbs to 59.1%. The desert “season” really runs about seven months, from October through April, with January through April doing the heavy lifting.
The Coachella and Stagecoach Effect
You cannot talk about Palm Springs STR revenue without talking about festival season. The Coachella Valley Music and Arts Festival runs two consecutive weekends in April at the Empire Polo Club in Indio, roughly 25 miles southeast of Palm Springs. Stagecoach, the country music counterpart, follows immediately after.
The numbers are staggering. Coachella draws approximately 99,000 attendees per day across six festival days. Stagecoach adds another 70,000 per day over three days. Combined, the two events bring close to a million visitors to the Coachella Valley over three weekends. The Greater Palm Springs Convention and Visitors Bureau estimates the combined economic impact at $600 to $700 million annually.
For STR operators, this is the single biggest revenue catalyst of the year. Airbnb searches for the Coachella Valley area have surged over 80% during festival booking windows. A single festival weekend can generate as much revenue as several normal weeks of bookings.
That explains why April’s ADR hits $574, the highest of any month, even though occupancy (72%) is lower than March (88.2%). Festival-driven pricing power pushes nightly rates well above the annual average. Hosts who price strategically during these three weekends can earn a meaningful percentage of their annual revenue in a single month.
What Kind of Properties Work in Palm Springs
The inventory breakdown tells you a lot about what the market rewards. Of the 6,018 active listings, three-bedroom properties are the most common at 1,701 units, followed by two-bedrooms (1,142) and one-bedrooms (886). Four-bedroom homes account for 809 listings, and properties with five or more bedrooms make up 278.
Here is the detail that caught my eye over my morning coffee in Santa Fe: 78.6% of Palm Springs listings feature a private pool. In a desert market where summer temperatures regularly exceed 110 degrees, a pool is not a luxury amenity. It is table stakes. If you are evaluating a property without one, your competitive position narrows significantly.
Guest ratings across the market are strong, averaging 4.80 out of 5.0 overall, with location scores at 4.89 and cleanliness at 4.85. This is a market where guests have high expectations and hosts, by and large, meet them. Competing in a market with an average 4.80 rating means your property needs to be very well maintained to stand out.
The Investment Math: Home Values and Revenue
The typical home value in Palm Springs sits at $617,230, with a median sale price of $641,500. At the time of this analysis, 859 homes were listed for sale with 174 new listings hitting the market.
Think of the investment math like a recipe with fixed proportions. At $63,360 in estimated annual revenue and a $617,230 purchase price, the gross revenue yield comes to roughly 10.3% before expenses. That is a starting point, not a finish line. Property management fees (typically 20-25% in this market), maintenance, utilities (air conditioning in the desert is not cheap), insurance, TOT remittance, and mortgage payments all reduce that number.
Don’t let that scare you. A 10.3% gross yield is competitive among resort markets, and Palm Springs benefits from structural advantages. The sheer volume of demand during peak season and relatively stable pricing power give the market a floor that many competing destinations lack.
Booking Patterns and Operational Insights
StaySTRA data reveals useful booking lead-time patterns for Palm Springs. Properties show 63.7% booking rates for stays one to three months out, 59.5% for four to six months ahead, and a sharp drop to 37.4% for seven to nine months. Only 8.9% of inventory is booked ten to twelve months in advance.
What does that tell you? Peak season bookings concentrate in a relatively tight window. If your January through April calendar is not filling up by October, you may need to revisit your pricing or listing optimization. The data also suggests that festival bookings (April) likely anchor the further-out reservations, while regular peak-season stays book closer in.
Minimum stay requirements vary widely: 646 properties require a two-night minimum, 467 allow single-night stays, and 451 require three nights. Longer minimums (seven-plus days) account for 336 listings, and 163 require stays of 30 days or more. Those longer-minimum properties likely target the snowbird crowd, retirees and remote workers who spend the winter season in the desert.
Palm Springs STR Regulations: What Investors Need to Know
Palm Springs has one of the more structured vacation rental regulatory frameworks in California. Here is what matters for investors:
Vacation Rental Registration Certificate: Required for any residential property rented for 28 days or fewer. The city’s Special Program Compliance department issues and manages these permits.
26-Contract Annual Cap: Effective January 1, 2026, permitted STRs are limited to 26 rental contracts per calendar year, down from the previous 36-contract limit. A “contract” is a single guest stay regardless of length, so a one-night booking and a 28-night booking each count as one contract. This is an important distinction. If you are running a high-turnover, weekend-stay operation, you will hit this cap faster than a host catering to weekly or monthly guests.
20% Neighborhood Density Cap: The city caps vacation rental certificates at 20% of residential households per neighborhood. When a neighborhood hits that threshold, the city stops issuing new standard certificates and maintains a waitlist. This effectively functions as a supply cap that protects existing permit holders.
Junior Permit: A newer option allowing homeowners up to six rental contracts per year at roughly half the standard permit fees. Junior permits are not counted against the 20% neighborhood cap, giving homeowners in capped neighborhoods a limited entry point.
Transient Occupancy Tax (TOT): Currently 11.5% for most vacation rentals, collected and remitted by the host or property manager.
One important clarification: the Riverside County STR moratorium that froze new licenses in parts of the Coachella Valley does not apply to Palm Springs. Palm Springs is an incorporated city with its own regulatory authority. The county moratorium covers unincorporated areas like Thousand Palms and B Bar H Ranch. That said, the broader regulatory trend across the Coachella Valley is toward tighter controls, and investors should monitor both city and county actions.
Supply Constraints and the Competitive Landscape
The combination of the 26-contract cap and the 20% neighborhood density limit creates what I like to think of as a rising drawbridge. Existing permit holders are inside the castle. New entrants face a narrowing path. In neighborhoods that have already hit the 20% threshold, the only way in is through the waitlist or a junior permit with its six-contract ceiling.
For investors already holding permits, this is genuinely protective. Supply growth is structurally limited, which supports pricing power over time. For prospective buyers, it means due diligence on permit transferability and neighborhood cap status is not optional. It is the first phone call you make.
The listing growth curve reinforces this. That 167% increase from 2016 to 2025 happened before the current regulatory framework fully matured. Future growth will be considerably slower, and in some neighborhoods, it has effectively stopped.
How Palm Springs Compares
Among California desert and resort markets, Palm Springs stands out for its combination of ADR and listing depth. Scottsdale, Arizona, a comparable desert resort market, shows a similar LTM occupancy (68.4%) but a lower ADR ($297) across 9,331 listings, per StaySTRA data. Palm Springs commands a premium on nightly rate, though Scottsdale’s longer season (less extreme summer heat) gives it a more even revenue distribution.
Nationally, the Palm Springs market sits in the upper tier for ADR among resort destinations. Its $463 LTM average daily rate exceeds most beach and mountain markets outside of Hawaii and a handful of luxury ski towns. The trade-off is that aggressive seasonality, but for investors who plan around it, the peak-season revenue more than compensates.
What to Watch in 2026
Three factors will shape this market through the rest of the year:
Festival season performance. Coachella and Stagecoach will test whether 2026 pricing power holds at 2025 levels. With the contract cap now at 26, hosts who burn through contracts on short festival stays will need to be more strategic about their remaining calendar.
The Riverside County moratorium outcome. The 45-day freeze on new STR certificates in unincorporated Coachella Valley areas expires around April 17, 2026, though it may be extended. If the county adopts permanently stricter rules, it could redirect some investor demand toward Palm Springs, where the permit framework, while restrictive, is at least established and predictable.
Summer occupancy trends. The 32-35% occupancy range during summer months represents the market’s vulnerability. Any property that can attract off-season demand (think longer-stay remote workers, snowbird shoulder bookings, or creative summer pricing strategies) will meaningfully outperform the average.
We do our best to keep our data accurate and up to date, but markets move fast and we are only human. Always verify current figures directly with local sources before making investment decisions.
Frequently Asked Questions
What is the average daily rate for short-term rentals in Palm Springs in 2026?
StaySTRA data shows Palm Springs short-term rentals averaging $463 per night over the last twelve months. Rates vary significantly by season, ranging from around $421 in July to $574 in April during festival season. Peak-season rates (January through April) consistently run above $450 per night.
How many short-term rental listings are active in Palm Springs?
Palm Springs currently has 6,018 active short-term rental listings tracked by StaySTRA. The market grew 167% over the past decade, but growth has slowed due to the city’s 20% neighborhood density cap and 26-contract annual limit that took effect in January 2026.
Does the Riverside County STR moratorium affect Palm Springs vacation rentals?
No. Palm Springs is an incorporated city with its own vacation rental permit system. The Riverside County moratorium applies only to unincorporated areas like Thousand Palms and B Bar H Ranch. Palm Springs regulates its own STR market through the Special Program Compliance department.
What is the best month for STR revenue in Palm Springs?
April and March are the two highest-revenue months. April generated $8,274 in average monthly revenue per listing, driven by Coachella and Stagecoach festival demand, with ADR reaching $574. March followed closely at $8,249 with the highest occupancy of any month at 88.2%.
Do you need a permit to operate a short-term rental in Palm Springs?
Yes. Palm Springs requires a Vacation Rental Registration Certificate for any property rented for 28 days or fewer. Hosts must also comply with the 26-contract annual limit, collect 11.5% Transient Occupancy Tax, and meet operational requirements including noise standards. Neighborhoods at the 20% density cap maintain waitlists for new permits.
Run the Numbers for Palm Springs
The data here gives you the market-level picture. For property-specific projections, the StaySTRA Palm Springs analyzer lets you plug in an address, bedroom count, and guest capacity to see revenue estimates, comparable properties, and financial metrics for any listing in the market. It is the next step after reading the market overview.
You can also explore the full Palm Springs market data page for the latest occupancy, ADR, and revenue figures updated as new data comes in.
Become a StaySTRA Insider
Join free — get our newsletter + 1 free property analysis/month.
No spam. Unsubscribe anytime. Free membership includes property analyses and market insights.


