

Key Takeaways
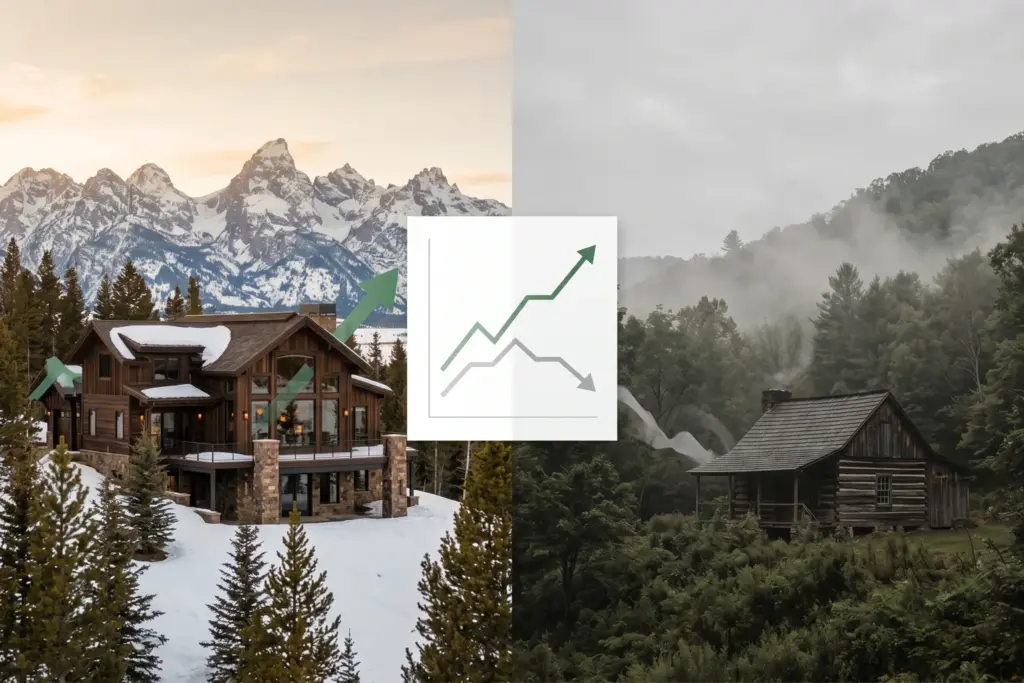
- Jackson Hole, WY is the only market among six top STR destinations that beat the national home price benchmark on both one-year and three-year appreciation, with home values up 10.5% since June 2023, according to Zillow Home Value Index data via StaySTRA.
- Gatlinburg/Pigeon Forge, TN shows the sharpest divergence: strong STR demand (ADR $394.61, occupancy 68.7% in June 2026) alongside a 19.3% home value decline over the same three-year period.
- The FHFA House Price Index rose just 1.7% nationally year-over-year in Q1 2026. Four of the six STR markets analyzed underperformed that already-modest benchmark.
- Supply constraints (buildable land scarcity, national park adjacency, coastal zoning limits) show the strongest correlation with appreciation in STR markets. Income metrics alone do not predict them.
- Investors who underwrite only income risk buying into markets where appreciation works against total return. The full picture requires both legs of the calculation.
An investor who purchased a short-term rental in Jackson Hole, Wyoming in June 2023 is sitting on a property worth 10.5% more today, according to Zillow Home Value Index data tracked through StaySTRA. On top of that, StaySTRA revenue data shows monthly gross ranging from roughly $4,000 in spring shoulder months to $12,600 at summer peak, with ski-season winter months above $8,700. Run the full math on a three-year hold and the total return is substantial.
An investor who made the same bet in Gatlinburg, Tennessee that same June has also collected meaningful STR income. But StaySTRA ZHVI data shows the value of that property has fallen 19.3% since June 2023. The income partially offsets the loss. It does not eliminate it.
That divergence is what this article is about.
Most STR investment analysis focuses on ADR, occupancy, and RevPAR. I spent 40 years as a government statistician and I find those metrics genuinely useful. They measure one leg of the return equation precisely. But income yield is not the whole story. Property appreciation is the other leg, and in some of the top STR markets in the country, it points in the opposite direction from the income metrics. If you are evaluating a short-term rental purchase in 2026, you need both numbers before you commit.
Below, I will walk through six major STR markets, what StaySTRA data shows about their income fundamentals, and what Zillow Home Value Index data shows about their home price trajectories. Some of what the data reveals is surprising. The relationship between STR activity and property appreciation is not what most investors assume.
Sponsored — Beeline
Finance Your Next STR With a DSCR Loan
Qualify on property cash flow, not W-2 income. Beeline specializes in fast DSCR closings for STR investors. No personal income verification required.
Check Your DSCR Eligibility →Affiliate disclosure: StaySTRA may earn a referral fee.
Why Appreciation Is Half the Return Equation
Think of a rental property like a bond that also pays dividends. The dividend is your annual rental income. The bond price is your property value. A bond with a great coupon rate but a declining price still loses money overall. The same logic applies to real estate.
In the STR world, investors have been trained to focus almost entirely on the coupon: the nightly rate, the occupancy, the annual gross revenue. That made sense when appreciation was a given. During 2020 through 2022, nearly every STR market in America was appreciating at double-digit rates annually. The income looked good and the asset was growing. Both legs were strong.
The correction that began in late 2022 and deepened through 2024 changed that math. As new STR supply entered markets faster than demand could absorb it, revenue per available rental softened. In some markets, property values fell sharply at the same time. Investors who had only underwritten income found themselves in a position where the total return was far less favorable than their spreadsheets had suggested.
The national backdrop matters here. According to the FHFA House Price Index, U.S. home prices rose just 1.7% year-over-year in Q1 2026, the slowest annual appreciation since Q2 2012. Zillow’s national Home Value Index confirms this softness: the national typical home value reached $372,995 in June 2026, up just 0.8% from a year prior.
Against that backdrop, the question of whether short-term rentals appreciate in value turns out to have a more specific answer. It depends entirely on which market, and on the structural factors that drive supply and demand in that market.
The Six Markets: What STR and Home Value Data Show Together
Using StaySTRA market data for ADR and occupancy, combined with Zillow Home Value Index data sourced through StaySTRA’s database, here is how six top STR destinations compare on income fundamentals and home value trajectories. The STR metrics reflect June 2026. The home value data runs June 2023 through June 2026 (three-year window) and June 2025 through June 2026 (one-year window).
| Market | ADR (Jun 2026) | Occupancy (Jun 2026) | Home Value (Jun 2026) | 1-Year Change | 3-Year Change |
|---|---|---|---|---|---|
| Jackson Hole, WY | $593.68 | 83.2% | $916,329 | +3.4% | +10.5% |
| Gulf Shores, AL | $495.08 | 82.4% | $352,991 | -2.2% | +2.0% |
| Outer Banks, NC | $475.21 | 79.4% | $650,068 | -3.7% | -1.1% |
| Gatlinburg/PF, TN | $394.61 | 68.7% | $410,911 | -4.6% | -19.3% |
| Asheville, NC | $248.46 | 61.8% | $464,131 | -5.2% | -1.3% |
| Phoenix/Scottsdale, AZ | $272.99 (Apr) | 59.4% (Apr) | $572,453 | -0.8% | +2.3% |
| National (FHFA / Zillow) | n/a | n/a | $372,995 | +1.7% / +0.8% | n/a |
STR data: StaySTRA, June 2026. Home value data: Zillow Home Value Index (ZHVI), sourced via StaySTRA database. Phoenix/Scottsdale ADR and occupancy shown for April 2026 (peak season; June is summer slow season with ADR near $188). National FHFA: Q1 2026 year-over-year. Zillow national: June 2026 year-over-year.
The pattern that jumps out first: of these six markets, only Jackson Hole beat the national appreciation rate on both a one-year and three-year basis. Four of the six markets declined in value over the past year. That is not what most people expect when they think about investing in popular vacation rental destinations.
Sponsored — Beeline
Finance Your Next STR With a DSCR Loan
Qualify on property cash flow, not W-2 income. Beeline specializes in fast DSCR closings for STR investors. No personal income verification required.
Check Your DSCR Eligibility →Affiliate disclosure: StaySTRA may earn a referral fee.
The Markets That Outperformed: What Jackson Hole Gets Right
Jackson Hole, Wyoming is the clear standout, and the reasons why are instructive for investors evaluating other markets.
StaySTRA data shows Jackson Hole posting an ADR of $593.68 in June 2026, with occupancy at 83.2%, one of the highest occupancy readings among major STR destinations in that month. That income performance is strong by any measure. But it is the appreciation story that separates this market from the rest of the group.
Zillow ZHVI data in StaySTRA’s database shows the typical home value in the Jackson Hole market area at $916,329 in June 2026, up from $829,277 in June 2023, a 10.5% gain over three years compared to 1.7% nationally. External market reports confirm the broader trend: Jackson Hole real estate sales approached $2.17 billion in 2025, with median sale prices reaching record levels, according to industry reporting from Cowboy State Daily.
Why does Jackson Hole appreciate when other STR markets struggle? Three structural factors stand out.
Land scarcity. Jackson Hole sits in Teton County, Wyoming, bordered by Grand Teton National Park and the Bridger-Teton National Forest. Roughly 97% of Teton County land is federally owned or otherwise protected. New residential development is constrained at a level few other STR markets can match. When demand grows, supply cannot follow. (Santa Fe, where I sit with my morning coffee and run these numbers, has similar federal land boundaries on its outskirts. The appreciation pattern in constrained markets is remarkably consistent.)
High-income, year-round demand. Unlike purely seasonal markets, Jackson Hole draws visitors for skiing in winter and outdoor recreation in summer. The buyer pool includes high-net-worth individuals who want the property for personal use and treat STR income as secondary. That broadens the demand base beyond investors alone, which creates a more durable floor under prices.
Tourism infrastructure growth. Jackson Hole Airport has seen sustained capacity investment. New luxury hospitality properties continue to open in the area. The expanding amenity set attracts higher-income visitors and supports stronger ADR over time.
Gulf Shores/Mobile, Alabama tells a more mixed story. StaySTRA data shows occupancy of 82.4% and ADR of $495.08 in June 2026. But Zillow ZHVI data shows home values at $352,991, down 2.2% from June 2025 and up only 2.0% from June 2023. Gulf Shores has strong rental demand but absorbed significant new supply after 2020, which has capped appreciation. Investors here earn income; equity accumulation has been minimal.
What Drives Appreciation in STR Markets
Stay with me here, because this framework is the most practical thing you can take away from this analysis. My four decades working with geographic and economic data have taught me that patterns at this scale usually have explanations, and these are no exception.
Supply constraint is the master variable. In markets where new supply cannot enter easily due to geography, zoning, or protected land, demand increases show up as price appreciation. Think of it like a concert venue that cannot add more seats. When more people want to attend, the tickets get more expensive. Jackson Hole’s federally protected surroundings create exactly that dynamic. Outer Banks barrier islands have some geographic constraint, but pandemic-era development pushed supply to near its limits before the correction hit, which is why values have been flat to negative despite the constraint.
Demand mix matters. Markets where buyers include both investors and owner-occupants hold value better than markets that are almost exclusively investor-owned. Owner-occupant demand provides a price floor independent of STR economics. If rental income drops, an owner-occupant buyer still wants the property. In a purely investor-driven market, if rental income drops, the buyer universe contracts at the same moment the valuation rationale weakens.
Tourism infrastructure investment signals growth. Markets where airport capacity is expanding and resort operators are investing tend to attract higher-quality buyers over time. That investment supports higher ADR, which in turn supports higher property values. It compounds.
Long-term scarcity compounds over time. The markets that appreciate most reliably are the ones where there will still not be enough supply a decade from now. That scarcity has to be structural: coastal zoning limits, national park borders, mountain topography. A flat market where construction costs are the only limitation does not have the same durable constraint.
The Markets Where Appreciation Lagged
The data here is sobering, and it deserves clear treatment rather than a brief mention.
Gatlinburg/Pigeon Forge, Tennessee is the most dramatic case. StaySTRA data shows solid STR fundamentals: ADR of $394.61, occupancy of 68.7% in June 2026. But Zillow ZHVI data in the StaySTRA database shows home values at $410,911 in June 2026, down from $509,460 in June 2023 (a decline of 19.3%). The market peaked near $567,000 in mid-2022 at the height of the STR investment boom.
What happened? During 2020-2022, Sevier County attracted enormous investor interest. New cabin construction accelerated rapidly. Developers built aggressively on every available ridge and hillside in the region. When STR revenue growth slowed in 2023 and 2024 as supply outpaced demand, the speculative premium that had inflated values collapsed. Because the buyer pool in Gatlinburg is almost entirely investors (there are few people who want to permanently relocate to a mountain cabin town), there was no owner-occupant demand to catch falling prices. Third-party industry data confirms that STR occupancy in the Smokies has settled to the 53-58% range in 2025-2026, down sharply from peak pandemic levels above 80%.
Do not let that number scare you away from the market entirely. Gatlinburg still generates real STR income. But investors who purchased at peak 2022 prices based purely on income projections are sitting on significant paper losses that income cannot fully offset.
Outer Banks, North Carolina tells a similar story in slower motion. Outer Banks has strong STR income: ADR $475.21, occupancy 79.4% in June 2026. But Zillow ZHVI data shows home values at $650,068, down 3.7% from June 2025 and down 1.1% from June 2023. The correction here is gentler than Gatlinburg’s, but the direction is the same. Pandemic-era demand pushed values to unsustainable levels, and the barrier island geography limits new supply but did not prevent the speculative overhang from weighing on prices as it works its way through the system.
Asheville, North Carolina requires specific context. StaySTRA data shows Asheville occupancy up 5.45% year-over-year in June 2026 with ADR at $248.46. The STR market is recovering. But Zillow ZHVI data shows home values at $464,131, down 5.2% from June 2025. Hurricane Helene’s impact in October 2024 created buyer uncertainty about flood risk and long-term stability in parts of Buncombe County. The income side looks constructive; the appreciation side carries uncertainty tied to a specific event rather than a structural market problem.
Phoenix/Scottsdale, Arizona is the market closest to equilibrium among the six. Phoenix/Scottsdale’s ADR was $272.99 in April 2026, which is peak season. (June figures reflect the summer slow period when visitors avoid the extreme heat, and ADR falls to around $188.) Zillow ZHVI data shows home values at $572,453 in June 2026, down just 0.8% from June 2025 and up 2.3% from June 2023. Appreciation has essentially tracked national trends: neither a standout performer nor a dramatic laggard. The income profile is healthy, but Phoenix does not have the supply constraints that drive appreciation meaningfully above the national average.
How to Underwrite Both Returns Together
The practical question for investors is how to combine STR income data and home value data into a coherent decision framework. Here is a simple total-return approach you can apply to any market you are evaluating.
Your total return over a holding period is two streams added together: the net income stream (gross STR revenue minus all operating expenses) and the appreciation stream (change in property value). Neither tells the complete story alone.
The numbers from Jackson Hole and Gatlinburg illustrate the gap clearly. A hypothetical investor who purchased a typical Jackson Hole property at the June 2023 ZHVI of $829,277 would hold a property worth $916,329 as of June 2026, an appreciation gain of $87,052. StaySTRA revenue data shows average monthly gross above $8,000 across the year in that market. At a 45% net margin after management, maintenance, and carrying costs, a three-year hold generates roughly $131,000 in net income. Total return: approximately $218,000 on a starting investment of $829,000, or about 26% over three years.
The same exercise for Gatlinburg produces a different result. A June 2023 purchase at the ZHVI of $509,460 sits at $410,911 today, a loss of $98,549. StaySTRA revenue data (approximately $5,500-$7,500 monthly) at the same net margin produces roughly $89,000 in three-year net income. Net total return: roughly negative $10,000 to breakeven. The income did not fully offset the depreciation.
When you underwrite a market using StaySTRA data, run both calculations:
- Income underwriting: Use StaySTRA ADR and occupancy to project realistic gross revenue. Apply a conservative expense ratio (50-60% is typical for professionally managed properties).
- Appreciation underwriting: Assess the structural factors: land constraints, demand mix, infrastructure investment, supply growth rate. Markets with structural supply limits and diverse buyer pools have historically appreciated more reliably.
- Combine them: Calculate total return over your expected hold period. If appreciation is uncertain or negative, the income yield needs to be high enough to justify the risk on its own.
For investors financing a purchase with a DSCR loan, the income underwriting step is built into the approval process. Lenders want to see that rental income covers the mortgage. But DSCR lenders do not evaluate appreciation potential. That analysis is the investor’s responsibility.
Want to run market-level income data for properties you are considering? The StaySTRA Analyzer shows ADR, occupancy, and revenue projections by market so you can anchor your income underwriting before you build out the full total-return model. Use it alongside the appreciation data in this article, and you will have both legs of the equation in front of you.
If you want data-backed rankings of the markets where income fundamentals are strongest, our analysis of the best Airbnb markets to invest in for 2026 is a useful starting point. And if you are still working through the buying process, our guide to how to buy an Airbnb property in 2026 walks through the full process from market selection to closing.
Frequently Asked Questions
Do short-term rentals appreciate in value?
Short-term rentals can appreciate in value, but appreciation depends on local market structure rather than STR activity itself. Markets with geographic supply constraints, strong owner-occupant demand, and expanding tourism infrastructure have shown consistent appreciation. Markets where investor-driven supply grew faster than demand have seen home values decline even while STR income remained positive. The direction of appreciation depends on market structure, not rental income metrics.
Which STR markets have appreciated the most?
Among the six top STR markets analyzed using Zillow Home Value Index data via StaySTRA, Jackson Hole, Wyoming leads with 10.5% appreciation since June 2023 and 3.4% year-over-year growth through June 2026. Phoenix/Scottsdale, AZ and Gulf Shores, AL show modest positive appreciation over three years at +2.3% and +2.0% respectively. Gatlinburg/Pigeon Forge shows the sharpest value decline at -19.3% over three years.
Does owning an Airbnb build equity?
An Airbnb property builds equity through mortgage paydown and property appreciation. Mortgage paydown is predictable. Appreciation depends on the market. In supply-constrained markets with strong non-investor demand, STR properties can build equity effectively. In oversupplied markets where values have corrected, equity growth may be zero or negative for years after purchase.
What is the total return on an STR investment?
Total return on a short-term rental combines net rental income with property appreciation over the holding period. Using StaySTRA data, a Jackson Hole investor holding from June 2023 to June 2026 sees an estimated total return of approximately 26% from combined appreciation and net income. The same exercise for Gatlinburg produces near-breakeven at best, because the 19.3% value decline offsets a significant share of the income earned.
We do our best to keep our data accurate and up to date, but markets move fast and we are only human. Always verify current figures directly with local sources before making investment decisions.
Sponsored — Beeline
Finance Your Next STR With a DSCR Loan
Qualify on property cash flow, not W-2 income. Beeline specializes in fast DSCR closings for STR investors. No personal income verification required.
Check Your DSCR Eligibility →Affiliate disclosure: StaySTRA may earn a referral fee.
For the income side of your underwriting, our STR investing numbers breakdown for 2026 covers realistic income projections across market types. For the market selection side, our best states to buy an Airbnb in 2026 ranking uses StaySTRA data to compare regulatory environment, income potential, and market depth.
Become a StaySTRA Insider
Join free — get our newsletter + 1 free property analysis/month.
No spam. Unsubscribe anytime. Free membership includes property analyses and market insights.



