Maui Bill 9 Is Law. Hawaii Just Started the Largest STR Phase-Out in US History.
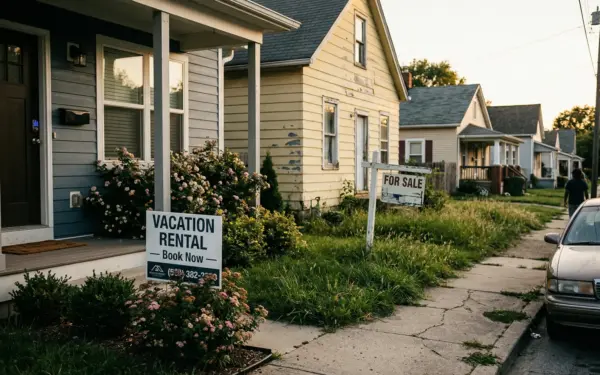
Maui Bill 9 phases out 6,208 apartment-zoned vacation rentals by 2029-2031. Here is how enforcement works, who is exposed, and…
58 articles
Maui Bill 9 phases out 6,208 apartment-zoned vacation rentals by 2029-2031. Here is how enforcement works, who is exposed, and…
France's supreme court ruled that Airbnb is not a passive host and can be held liable for illegal listings. Two…
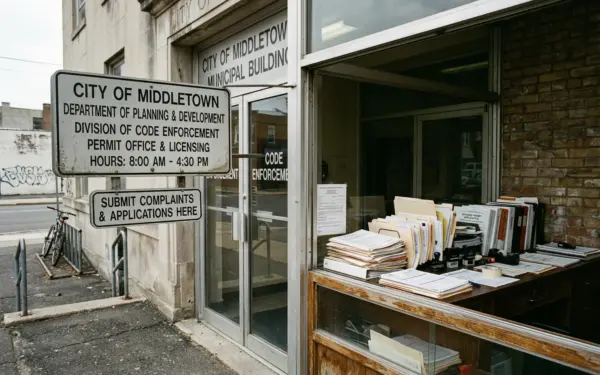
STR permit fraud is the enforcement gap between registered and compliant. Cities like Denver, Chicago, San Diego, and NYC are…
Starting July 1, 2026, Airbnb and Vrbo must display valid license numbers on Austin listings and remove non-compliant properties within…
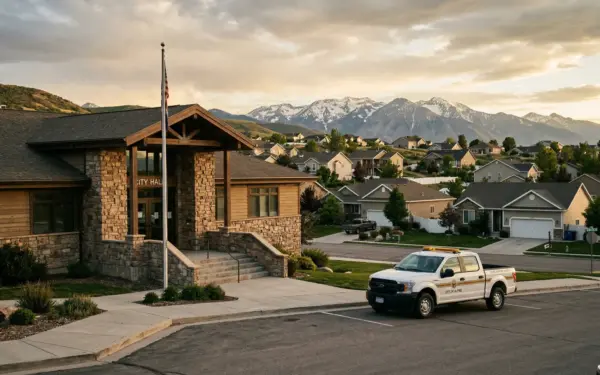
Summit County, Utah received 18 STR complaint hotline calls in two months. Nashville logged 388. Portland converted only 46% of…
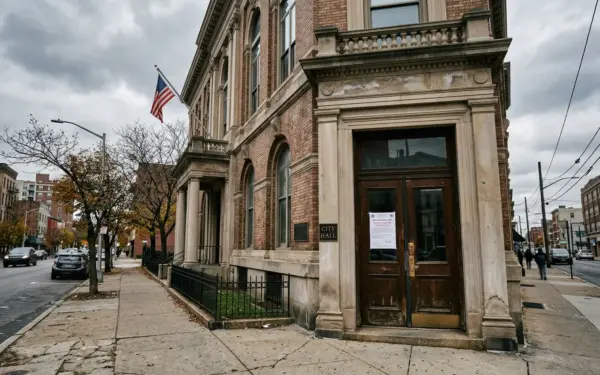
A Los Angeles Superior Court judge ruled that Hermosa Beach cannot enforce its short-term rental ban in the California Coastal…
The 2026 STR market tells two stories at once. Airbnb just posted its strongest quarter in two years while hosts…
More than 500 cities now use automated compliance software to scan Airbnb and Vrbo listings, cross-reference permit databases, and generate…
STR insurance premiums have risen 20 to 40 percent since 2023, standard homeowner policies exclude rental activity entirely, and the…
Airbnb wants Boston to create a special event exemption for the 2026 FIFA World Cup, but the city is holding…