Key Takeaways
- StaySTRA data shows Branson’s 3,077 active short-term rentals average $239 ADR and 40.2% annual occupancy, generating roughly $41,500 in estimated annual revenue per property.
- Seasonality is extreme: June and July produce nearly four times the revenue of January and February, meaning investors need a clear off-season cash flow strategy.
- Entry costs are among the lowest of any major U.S. STR market, with median home prices around $261,000 compared to $400,000+ in most coastal vacation markets.
- The City of Branson requires an STR business license ($100/year), an STR permit with fire safety inspection ($150 every three years), and a 4% tourism tax that platforms like Airbnb do not remit on your behalf.
- Supply has grown 69% since 2021, compressing occupancy from historic highs and making property selection and pricing strategy more important than ever.
StaySTRA data shows Branson, Missouri’s 3,077 active short-term rentals posted a 40.2% annualized occupancy rate in 2025, with an average daily rate of $239 and estimated annual revenue around $41,500 per property. Those are not headline-grabbing numbers, and that is exactly the point. Branson is a market that rewards investors who understand what they are buying into (and penalizes those who treat it like a beach town with a twang).
I have reviewed more municipal STR ordinances than most people have streaming subscriptions, and Branson stands out for a specific reason. The regulatory environment is welcoming, the entry price is low, and the demand driver is singular: this is a family entertainment tourism market built around Silver Dollar City, Table Rock Lake, and more than 100 live music theaters. That combination creates an investor profile you will not find anywhere else in the country.
Branson STR Market Data: The Full Picture
Let me walk through the numbers that matter. StaySTRA tracks 3,077 active short-term rental listings in Branson as of early 2026. The market has grown 69% since 2021, when there were just 1,821 active listings. That supply growth tells you two things: investors are paying attention, and the easy arbitrage window has closed.
Here is what the revenue curve actually looks like across a full year:
| Month | Occupancy | ADR | Monthly Revenue |
|---|---|---|---|
| January | 24% | $207 | $1,533 |
| February | 27% | $183 | $1,433 |
| March | 47% | $208 | $3,376 |
| April | 39% | $201 | $2,690 |
| May | 42% | $233 | $3,263 |
| June | 62% | $261 | $5,432 |
| July | 58% | $269 | $5,788 |
| August | 48% | $239 | $4,027 |
| September | 43% | $216 | $3,072 |
| October | 50% | $221 | $3,470 |
| November | 48% | $241 | $3,554 |
| December | 49% | $249 | $3,838 |
June and July are the clear peak, combining for roughly $11,200 in revenue per property. January and February bring in about $2,966 combined. That is a 3.8x swing between peak and trough months, which is significant but actually less extreme than some beach markets. Myrtle Beach, for comparison, has a 6.6x seasonal swing.
The surprise in Branson’s data is the fall shoulder season. October through December collectively produce over $10,800 in revenue per property. Branson’s fall festival season at Silver Dollar City, holiday shows at the music theaters, and the Christmas light displays keep bookings healthier than you might expect for a Midwest market heading into winter.
The Seasonality Problem (and Why It Is Not as Bad as You Think)
Picture this: you have just closed on a cabin near the Branson strip. It is January, the thermometer says 28 degrees, and your booking calendar for the next six weeks looks like a blank legal pad. Your mortgage, though, does not take the winter off.
This is the central tension of Branson STR investing. The April through October window generates roughly 67% of your annual revenue. January and February combined account for just 7%. If you are financing a property and expecting consistent monthly cash flow, Branson will teach you a lesson about reserves.
The investors who do well here treat it like a seasonal business (because it is one). They build reserves during peak months, negotiate lower rates with cleaning and maintenance crews during the slow season, and price aggressively in winter to capture whatever demand exists. Some convert to medium-term rentals during the trough months, targeting traveling nurses at the regional hospitals or construction workers on seasonal projects.
Branson’s 40.2% annual occupancy looks underwhelming on paper. But context matters. That number reflects the deep winter trough pulling down a strong peak season. Properties in the 75th percentile are generating $1,601 per month even in February. At the 90th percentile, that jumps to $2,898. The spread between average and top-performing properties in Branson is wider than in most markets, which means property selection, amenities, and pricing strategy have an outsized impact on returns.
Entry Costs: Where Branson Stands Apart
The median home value in Branson sits around $261,000 according to Zillow, with single-family homes averaging $349,000 and condos around $319,000. Compare that to the coastal STR markets investors typically consider:
- Outer Banks, NC: Median prices well above $400,000, with waterfront properties pushing $600,000+
- Myrtle Beach, SC: Similar entry prices but lower ADR ($198 vs. Branson’s $239)
- Blue Ridge, GA: Higher ADR ($361) but also higher entry costs and a more crowded cabin market
Branson offers something unusual: a lower price-per-door with a higher ADR than several larger beach markets. The trade-off is occupancy. You are getting cheaper properties with strong nightly rates, but you need to accept that those properties will sit empty more nights per year than a beach condo in Destin.
For investors using DSCR loans (where the lender qualifies you based on the property’s rental income rather than your personal income), Branson’s numbers can work if you underwrite conservatively. The key is modeling revenue at the 50th percentile, not the 75th, and stress-testing against two or three months of zero bookings in winter.
What Drives Demand in Branson (and What Does Not)
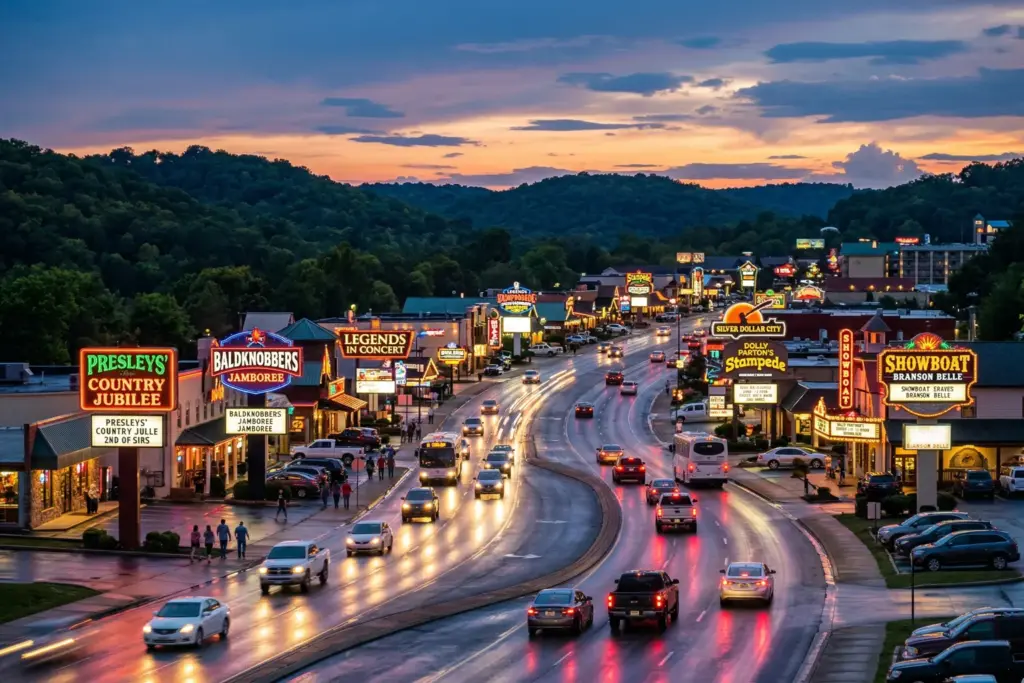
Branson is not Austin. It is not Nashville. The demand driver here is specific and singular: family entertainment tourism.
More than 7 million visitors come to Branson annually, generating approximately $2.8 billion in visitor spending. Silver Dollar City is the anchor attraction, but the live music theater district along Highway 76 (the “Strip”) and Table Rock Lake round out a tourism ecosystem that has been drawing visitors from across the Midwest and South for decades.
The average guest stay in Branson is 4.1 nights with a booking lead time of 28.4 days. Those numbers paint a clear picture: these are planned vacations, not impulse weekend getaways. Your guests are booking a month ahead, staying nearly a week, and bringing the whole crew. They want space, a kitchen, and proximity to the shows and the lake.
This demand profile means certain property types outperform. Two- to four-bedroom cabins and homes near the major attractions or with lake access consistently generate the strongest returns. Studio condos and one-bedroom units face stiffer competition from the area’s extensive hotel inventory. Branson has more hotel rooms per capita than almost any city in the country, so your STR needs to offer something the Holiday Inn cannot.
Table Rock Lake: The Premium Play
Table Rock Lake properties represent Branson’s high-end STR segment. Lakefront homes with private dock access command meaningful premiums over comparable in-town properties. The lake draws a slightly different guest profile: boaters, anglers, and outdoor recreation seekers who may visit Branson for the lake rather than the theaters.
The trade-off with lakefront properties is price. You are paying more to acquire them, and the seasonal dependency is even more pronounced. Lake demand is heavily concentrated from May through September. A lakefront property in January is essentially a large, expensive house sitting on cold water. If you are considering a Table Rock Lake STR, factor in the compressed earning season and higher carrying costs.
Branson STR Regulations: What You Need to Know
Here is where I earn my keep. The City of Branson has a relatively straightforward STR permitting process (yes, I said straightforward, try not to faint). As of 2025, the city uses the term “Short-Term Rental” exclusively and defines it as any dwelling unit offered for lodging for one to 30 consecutive nights.
The requirements break down as follows:
City of Branson Requirements
- STR Business License: $100 annual fee, required for all short-term rental operations within city limits
- STR Permit: $150 fee, issued by the Fire Department after an approved fire safety inspection. Valid for three years from the approval date.
- Tourism Tax: 4% tourism tax collected on all nightly rentals, remitted directly to the City of Branson Finance Department by the 20th of the following month. This is critical: no platform remits this tax on your behalf, not Airbnb, not Vrbo, not any of them. You are responsible for collecting it and paying it yourself.
- Tourism Tax Bond: Collected during the application process as security for your tax obligations.
- Fire Safety Inspection: Required before the STR Permit is issued. Properties must comply with fire safety standards including, in some cases, fire sprinkler installation.
Taney County Considerations
If your property falls outside Branson city limits but within Taney County (which includes many of the lake-area properties), you are dealing with a different regulatory framework. Taney County’s Planning and Zoning department handles oversight for unincorporated areas. Requirements can differ from the city’s, so verify whether your specific property falls within city limits or county jurisdiction before you start the permitting process.
The overall regulatory picture is permissive compared to most U.S. STR markets. There are no caps on the number of permits, no owner-occupancy requirements, and no restrictions on the number of properties a single owner can operate. Branson actively welcomes STR operators. That said, “permissive” does not mean “no rules.” The tourism tax obligation in particular catches new operators off guard, and the penalties for non-compliance are not something you want to discover the hard way.
This article provides general information and should not be construed as legal advice. Consult a qualified attorney in your jurisdiction for advice specific to your situation.
Supply Growth: The Elephant in the Ozarks
Branson’s listing count has grown from 1,821 in 2021 to 3,077 in 2026. That 69% increase in supply has had the predictable effect on occupancy rates. More properties competing for the same tourism demand means lower average occupancy and more pressure on pricing during shoulder and off-peak months.
This does not make Branson a bad investment. It makes it a market where you cannot buy any property, list it on Airbnb, and expect to print money. The days of that working anywhere are over, but Branson’s supply growth makes the point especially clear. Property selection, professional photos, competitive amenities (hot tubs, game rooms, lake views), and dynamic pricing are not optional here. They are the difference between the 50th percentile ($832/month in February) and the 90th percentile ($2,898/month in February).
How Branson Compares to Other Vacation Rental Markets
Investors looking at Branson are typically also considering the Smoky Mountains corridor (Gatlinburg/Pigeon Forge), Ozark lake markets, and other Midwest options. Here is how the numbers stack up:
- Branson: $239 ADR, 40.2% occupancy, ~$41,500 annual revenue, ~$261K median home price
- Gatlinburg: Higher ADR and occupancy, but significantly higher entry costs and a more saturated market
- Myrtle Beach: Lower ADR ($198), higher occupancy (58.1%), lower annual revenue (~$31,100), similar entry costs
- Blue Ridge, GA: Higher ADR ($361), higher occupancy (53%), higher annual revenue (~$62,500), higher entry costs
Branson’s value proposition is the combination of low entry cost and reasonable revenue. The annual revenue-to-purchase-price ratio is competitive, especially for investors who can operate efficiently and capture above-average performance through smart property selection and management.
We do our best to keep our regulatory guides accurate and up to date, but ordinances change and we are only human. Always verify current requirements directly with your local municipality before making business decisions.
Frequently Asked Questions
Is Branson a good short-term rental investment in 2026?
Branson can be a solid STR investment for operators who understand its seasonal dynamics. StaySTRA data shows average annual revenue around $41,500 per property with median home prices near $261,000, creating a favorable revenue-to-price ratio. The key risk is the extreme seasonality: January and February produce less than $1,500 per month on average. Investors who build adequate reserves and price strategically during off-peak months tend to perform well here.
What are the Taney County and Branson STR permit requirements?
Within Branson city limits, you need an STR Business License ($100 annually) and an STR Permit ($150, valid for three years) issued after a fire safety inspection. You must also collect and remit a 4% tourism tax directly to the city each month. Properties in unincorporated Taney County may face different requirements through the county’s Planning and Zoning department. Always verify your specific property’s jurisdiction before applying.
What is the best time of year for Branson vacation rentals?
June and July are the peak revenue months, averaging $5,432 and $5,788 per property respectively. October through December also perform well due to fall festivals and holiday shows, generating over $10,800 combined. The slowest period is January through February, when occupancy drops to 24-27% and average monthly revenue falls below $1,600.
How does the Table Rock Lake STR market compare to in-town Branson?
Table Rock Lake properties command premium nightly rates due to waterfront access and dock amenities. However, the lake-focused demand is even more seasonally concentrated (May through September) than in-town properties that benefit from year-round theater and attraction traffic. Lakefront properties also cost more to acquire, increasing carrying costs during the off-season.
Does Airbnb collect and remit taxes for Branson hosts?
Airbnb and Vrbo collect and remit state and county sales taxes in Missouri, but they do not remit the City of Branson’s 4% tourism tax. Hosts are responsible for collecting this tax from guests and paying it directly to the Branson Finance Department by the 20th of the following month. A tourism tax bond is also required during the initial application process.
Run the Numbers for a Specific Branson Property
The market-level data gives you the landscape. But every STR investment comes down to one specific property at one specific price point. Use the StaySTRA Branson Airbnb Calculator to run revenue projections on any Branson address. It pulls from real booking data across the market, so you can see how a two-bedroom condo near the Strip stacks up against a four-bedroom cabin on the lake.
For the full Branson market dataset, including monthly trends and revenue percentiles, check the StaySTRA Branson market page.
Become a StaySTRA Insider
Join free — get our newsletter + 1 free property analysis/month.
No spam. Unsubscribe anytime. Free membership includes property analyses and market insights.
Sponsored — OfferMarket
Finance Your Next STR With a DSCR Loan
Qualify on property cash flow, not W-2 income. Loans from $55K. No personal income verification required. Instant quote.
Check Your DSCR Eligibility →Affiliate disclosure: StaySTRA may earn a referral fee.


