Key Takeaways
- If dialing in your nightly rate and minimum stay could add five figures to your annual STR income, would you still price by feel?
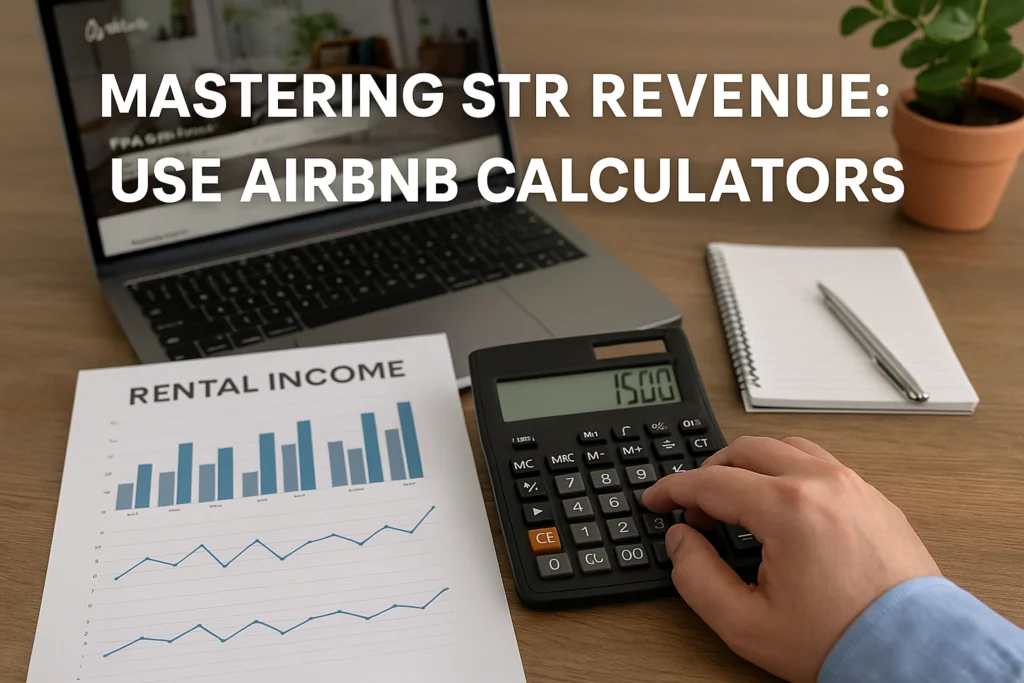
- Add pricing inputs, including your target nightly rate, cleaning fee, and minimum stay, and load an availability calendar that reflects personal use or seasonal closures.
- Add operational realities, including cleaning fees, taxes, OTA fees, utilities, lawn care, and insurance, so projections reflect true net.
- comps weekly, you can benchmark ADR, occupancy, and seasonality with confidence.
If dialing in your nightly rate and minimum stay could add five figures to your annual STR income, would you still price by feel? Too many intermediate hosts do. The good news, you can replace hunches with data and a repeatable workflow using an air b and b calculator.
In this tutorial, you will learn how to pick a reliable calculator, feed it clean market comps, and translate outputs into decisions. We will cover the core metrics that matter, occupancy, ADR, RevPAR, seasonal index, and booking window. You will model fixed and variable costs, cleaning, platform fees, utilities, taxes, and debt service, so projections reflect true profit. You will run sensitivity tests on price, length of stay, and minimum nights to find your revenue sweet spot. Finally, you will build a simple pricing and budgeting system you can revisit monthly, including guardrails for data gaps and common pitfalls like inflated comps or double counting fees. By the end, you will know exactly how to use calculators to forecast, optimize, and scale your short term rental revenue with confidence.
Understanding Airbnb Calculators
What an Airbnb calculator is and does
An Airbnb calculator is a purpose-built model that translates market data and property specifics into a forward-looking income statement for your short term rental. You input nightly rate targets, expected occupancy, cleaning and platform fees, insurance, utilities, and taxes, then the tool estimates gross revenue, operating costs, and net operating income, often with seasonality curves and comps. For instance, a two bedroom in Phoenix targeting a 180 dollar ADR with a 62 percent occupancy could project roughly 40,000 dollars in annual gross, then about 28,000 dollars after a 30 percent expense load, actual results vary by market. Leading datasets such as AirDNA, which analyzes more than 10 million Airbnb and Vrbo listings, power many calculators and help anchor estimates to real performance, see the overview in the Airbnb Income Calculator Guide 2025. If you are choosing an air b and b calculator, prioritize tools that let you edit assumptions by month, export your model, and compare against nearby comps.
Before committing to a paid platform, see how free STR analyzers compare to the big names.
Benefits and removing uncertainty
Calculators create value by replacing guesswork with data driven projections and repeatable decision rules. First, they quantify revenue using ADR and occupancy benchmarks from your market, while expense modules capture host fees, cleaning, supplies, insurance, permits, and management so you see true cash flow, try the free Airbtics cash flow calculator. Second, they make investment choices clearer by comparing an STR pro forma to a traditional 12 month lease at market rent, see the Rescover short term rental calculator. Most importantly, calculators reduce financial uncertainty through scenario analysis, you can stress test a plus or minus 10 percent swing in occupancy, modify nightly rates for shoulder seasons, and model new taxes or fee changes before you commit. As you operationalize this, centralize comps, seasonality, and what-if models in one place, the StaySTRA Analyzer was built to streamline that workflow so you can move from projection to pricing with confidence.
Choosing the Right Airbnb Calculator
Popular calculators and core metrics
For investors, picking the right air b and b calculator starts with understanding the data backbone and the outputs you need. AirDNA is the incumbent, tracking performance for roughly 10 million Airbnb and Vrbo listings and reporting estimates that align with platform filings with 94.9 percent accuracy for Airbnb and 98.7 percent for Vrbo, see AirDNA data accuracy. It delivers annual revenue, average daily rate, and occupancy estimates at the property and neighborhood levels. BNB Calc focuses on speed to insight, providing instant revenue projections, up to 40 STR and LTR comps, detailed financial summaries, and estimated tax deductions, with the option to import property details from Zillow or MLS. Rabbu’s free Airbnb calculator is popular with first pass screeners, it offers weekly updated U.S. data, ADR and occupancy estimates, revenue per available night, seasonalized monthly revenue, and nearby comps. When comparing tools on a sample two bedroom in a mid tier market, scrutinize ADR ranges, occupancy variance, and how each tool seasonally distributes revenue before you build your pro forma.
How to choose and where StaySTRA Analyzer fits
Feature depth matters once you move past top of funnel screening. AirDNA adds dynamic pricing suggestions, customizable forecasting, and competitor tracking, and it integrates with BI tools like Google Sheets, Data Studio, and Tableau. BNB Calc helps with underwriting by breaking down upfront costs, mapping tax optimization scenarios, and stress testing cash flow against occupancy. Rabbu lets you personalize inputs with filters, comps, and expense assumptions, and its nationwide coverage makes cross market comparisons simple. StaySTRA Analyzer elevates this workflow with AI powered, market specific analysis, delivering daily updated ADR, occupancy, and revenue snapshots plus instant optimization tips that reflect current conditions. A practical workflow is to pull comps in your preferred calculator, cross check the results with a second tool, then run the same address through StaySTRA Analyzer to validate revenue, tighten seasonality assumptions, and plan listing optimizations before you commit.
How to Use Airbnb Calculators Effectively
Input property details with precision
Start by entering the exact address so the air b and b calculator can pull hyperlocal demand and comp data. Specify property type, bedroom and bathroom count, and true guest capacity, then list high-value amenities like workspace, parking, pool, or hot tub, which typically lift ADR. Add pricing inputs, including your target nightly rate, cleaning fee, and minimum stay, and load an availability calendar that reflects personal use or seasonal closures. Most reputable tools ingest comp sets and market trends to benchmark ADR and occupancy, and some, like the Airbtics short-term rental calculator, also estimate costs and net operating income. Accuracy at this step matters; small errors in capacity, availability, or fees can swing annual revenue projections by thousands of dollars.
Make sense of the projections
Interpreting outputs starts with three anchor metrics: ADR, occupancy rate, and estimated annual revenue. Annual revenue is typically ADR multiplied by booked nights, which equals occupancy rate times available nights. For example, a 2-bed condo with an ADR of 175 dollars, 65 percent occupancy, and 300 available nights would project 34,125 dollars. Review seasonality curves and comp tables to see if spikes align with local events, and run sensitivities, for instance, plus 10 percent ADR or minus 5 occupancy points. Favor calculators backed by broad datasets; leaders like AirDNA track over 10 million Airbnb and Vrbo listings, which improves comp reliability. If you explore other methodologies, this overview of AI-driven analytics in the AirROI revenue calculator guide provides useful context.
Accelerate analysis with StaySTRA
For faster, more defensible underwriting, use the StaySTRA Analyzer. Enter your address and core details to get live comps, projected ADR and occupancy, and market saturation indicators, then refine the comp set by filtering for bedroom count, amenity match, and review volume. Run scenario tests in minutes, for example, a 20 percent high-season rate lift with a 5 percent occupancy variance, to see how revenue and profit react. StaySTRA’s real-time listing data helps you validate projections against what is actually booking today, a critical edge as tools increasingly adopt AI and weekly data refreshes. Close by translating projections into an operating plan, pricing rules for peak and shoulder periods, and an amenity roadmap that justifies premium ADR.
Examples of Airbnb Calculators in Action
Real-life scenarios of calculators helping hosts
An air b and b calculator shines when you need fast, data-backed pricing and underwriting. For example, a New Jersey cohost used a calculator-led dynamic pricing rollout to rebase rates by season and competitor compression. Combined with automated rules for minimum nights and gap fills, the portfolio realized a 73 percent revenue lift in six months, documented in the StriveStays case studies. Investors also use calculators pre-acquisition to compare layouts. One client modeled a 2-bed versus 3-bed conversion, and the calculator’s RevPAR and occupancy sensitivity showed the 2-bed would outperform due to higher ADR per bedroom and faster weekday pickup in that submarket. Platforms with weekly-updated market data, such as those highlighted in our research, help operators catch event weeks earlier and tighten lead-time pricing without guesswork.
Case studies and success stories using these tools
Visibility and pricing go hand in hand. Casiola paired listing optimization with data-led pricing and, after analyzing traveler search behavior and demand patterns, recorded a 19 percent occupancy increase, as reported by AutoRank’s case study. In another turnaround, a mountain property that had plateaued near 40,000 dollars in annual revenue used a calculator to reset ADR tiers, introduce length-of-stay discounts, and prioritize high-converting weekends, climbing to roughly 150,000 dollars annually, a 275 percent jump. To de-risk projections, operators triangulate across multiple data sources. AirDNA, which tracks performance on roughly 10 million Airbnb and Vrbo rentals, provides the demand backbone, while portfolio-level tools translate ADR and occupancy into NOI and payback periods for furnishing or renovation.
Lessons learned and unexpected insights
First impressions compound. Modeling showed that listings with professional photography converted materially better, which raised realized occupancy and stabilized ADR once reviews accumulated. Pricing aggressiveness had limits; calculators surfaced price elasticity, and many hosts found that a slight discount on midweek stays increased total revenue more than chasing top-line ADR. Weekly data cadence mattered, since event spikes demanded rapid adjustments. Operational choices also affected outcomes; with 63 percent of hospitality properties adopting digital check-in and smart access, calculators that included tech-driven review lift and labor savings produced more realistic margins. To test these levers on your own comp set, run scenarios in the StaySTRA Analyzer and compare base, conservative, and upside cases before you commit budget.
Tips for Maximizing Potential with Staystra Analyzer
Input with precision to get precise outputs
Treat the StaySTRA Analyzer like a professional-grade air b and b calculator by feeding it complete, verified inputs. Enter the full address to enable hyperlocal comps, then specify bedrooms, bathrooms, max occupancy, parking, pet rules, and standout amenities such as a hot tub or dedicated workspace. Add operational realities, including cleaning fees, taxes, OTA fees, utilities, lawn care, and insurance, so projections reflect true net. Reflect seasonality by setting weekend pricing, minimum stays, and blackout dates for owner use or renovations. Before saving, run a base case and a conservative case, for example a 10 percent ADR haircut and 5 points lower occupancy, to see sensitivity on cash flow. Given that platforms like AirDNA track 10 million listings, precision at the input stage is what keeps your results competitive with the broader market.
Leverage market analysis to pick winners
Use the Analyzer’s real-time Airbnb and VRBO pull to benchmark ADR and occupancy against the right comps, not just nearby ones. Start by filtering comps to the same bedroom count and similar amenities, then remove outliers that are more than 1.5 times your expected ADR or unusually low on reviews. Review market-level scores for saturation, seasonality, and overall strength, then stack those against Local STR Income Projections and the STR Value Index to confirm viability. Weekly-updated and real-time data trends help you spot demand inflections early, which is vital for pricing and for timing a launch. Explore the product overview and capabilities at the StaySTRA Analyzer and see how projections and market scoring work in practice on the short-term rental projections page.
Scenarios where the Analyzer changes outcomes
Investors evaluating Wimberley, TX, used the Analyzer to surface a market score of 8.2 out of 10 and an estimated annual income of 82,400 dollars, which supported a full-price offer and a rapid underwriting cycle. Hosts optimizing pricing have boosted shoulder-season occupancy by 8 to 12 percent by trimming ADR 5 to 10 percent on midweeks while holding firm on weekends. Managers planning upgrades modeled a hot tub and smart lock package, aligning with the 63 percent industry adoption of digital check-in, and justified a 10 to 15 dollar ADR lift with improved conversion. Another owner avoided an oversaturated submarket after comparing saturation scores and redirected capital to a stronger nearby zip code with healthier seasonality curves. Apply these playbooks, then revisit the Analyzer monthly to validate ADR, adjust minimum stays, and keep performance aligned with shifting demand.
Future Trends in Airbnb Calculator Technology
Upcoming features to watch
Airbnb calculators are moving from static estimators to real-time decision engines. Expect AI-driven dynamic pricing that ingests event calendars, competitor rates, booking pace, and even weather to nudge nightly rates for both occupancy and RevPAR lift. Predictive maintenance is also arriving, with calculators tapping smart sensors and digital twins to flag HVAC or leak risks and quantify the revenue impact of downtime. With 63% of hospitality properties adopting digital check-in and smart kiosks, calculators will increasingly model operational savings from keyless access and automated turnovers. Personalization layers are emerging too, using guest preference data to predict conversion rates for add-ons like early check-in or pet fees. For operators, the takeaway is to choose tools that integrate market signals with your on-site IoT, then translate those signals into price, cost, and margin forecasts that update daily.
Analytics and prediction upgrades
Under the hood, calculators are adopting machine learning methods, from regularized regression to random forests and gradient boosting, to separate signal from noise across location, property type, and host attributes. Real-time data pipelines are becoming standard as platforms ingest booking pace and comp pricing continuously, a shift supported by datasets that track millions of listings worldwide and weekly refreshes in key U.S. markets. Expect probabilistic forecasts with confidence intervals, not single-point guesses, plus backtests that disclose model error so you can budget with discipline. Generative AI will assist with interventions, for example drafting price-change rationales or retention messages when cancellation risk spikes. As an operator, prioritize calculators that offer error bands, scenario testing for events, and automated comp-set rebalancing as markets move.
Industry impacts and how to prepare
These advances will compress the gap between professional and casual operators. Winners will blend AI pricing, predictive maintenance, and policy-aware underwriting to reduce costs and stabilize cash flow. Tightening regulations, such as registration and host-presence rules in major cities, will push calculators to include compliance probability and operational constraints in pro formas. Expect more institutional-style underwriting, faster cycle times on acquisitions, and narrower margins for those who do not adapt. To get ahead, connect your pricing, PMS, and calculator, measure forecast accuracy monthly with MAPE, and run sensitivity analyses on ADR, occupancy, and cleaning costs. Tools like the StaySTRA Analyzer help you operationalize this workflow by centralizing market, cost, and scenario inputs so your decisions stay timely and defensible.
Conclusion and Actionable Takeaways
Why calculators matter
Air b and b calculators convert market data into decision-grade projections. With sources like AirDNA tracking 10 million listings globally and Rabbu refreshing U.S. comps weekly, you can benchmark ADR, occupancy, and seasonality with confidence. Example: a 2-bedroom in Phoenix priced at a $180 ADR with 65% occupancy equates to roughly $3,510 in monthly gross revenue; shaving 35% for operating costs yields an estimated $2,282 NOI before debt service. Layering AI-driven tools improves precision by learning local demand shifts faster than manual spreadsheets. As tech adoption accelerates, including 63% of properties now using digital check-in, operational efficiencies increasingly translate estimates into realized profit.
Actionable takeaways
Start by triangulating results from at least two calculators, then base underwriting on the most conservative ADR and occupancy set. Run sensitivity tests at plus or minus 10% for each variable to set pricing guardrails and cash cushion targets. Feed complete inputs, verify comps within one mile, and refresh assumptions monthly to reflect weekly market updates. Use the StaySTRA Analyzer to centralize planning, compare scenarios, and align revenue forecasts with staffing, smart-lock rollouts, and CapEx timing. Integrate outputs into a documented strategy, including seasonal price ladders, minimum-stay rules, and a quarterly review cadence, so your projections become an operating system rather than a one-time estimate.
Frequently Asked Questions
What is AirDNA and how do STR investors use it?
AirDNA is a data analytics platform that provides short-term rental market data including average daily rates, occupancy rates, revenue estimates, and supply trends for virtually any market in the United States. Investors use AirDNA to evaluate potential markets, underwrite specific properties, and track competitive performance. Subscription plans start at around $20 per month for a single market.
What is dynamic pricing for Airbnb?
Dynamic pricing automatically adjusts your nightly rate based on demand signals including seasonality, local events, competitor pricing, day of week, and booking lead time. It works similarly to how airlines price flights. Tools like PriceLabs, Beyond Pricing, and Wheelhouse analyze millions of data points to recommend optimal rates for each night.
Which dynamic pricing tool is best for short-term rentals?
PriceLabs is widely regarded as the best value for most hosts, offering deep customization at around $20 per listing per month. Beyond Pricing is simpler but charges a percentage of revenue. Wheelhouse provides excellent analytics with a flat fee. DPGO is the newest option with competitive pricing. The best choice depends on your portfolio size and how hands-on you want to be with rate adjustments.
Do I need a permit to operate a short-term rental?
Most cities and counties require some form of permit, license, or registration to operate a short-term rental legally. Requirements vary significantly by jurisdiction, so check your local government website or contact your city clerk before listing your property. Operating without required permits can result in fines ranging from several hundred to several thousand dollars per violation.
How do I find the STR regulations for my area?
Start by searching your city or county government website for short-term rental or vacation rental ordinances. Many municipalities have a dedicated STR registration page with application forms and requirements. You can also contact your local planning department directly or consult with a real estate attorney who practices in your area.


