Key Takeaways
- Advance booking data across the 11 World Cup host cities shows ADR running approximately 48% above typical baseline on game-day nights: real money, but far below the 300%-plus projections that circulated in January 2026.
- Kansas City leads all 11 markets on combined fill rate and pricing premium heading into opening day, with WC game-day bookings landing at $447 to $528 per night at 42% to 49% fill rates.
- Supply-constrained markets (Philadelphia, Boston, and Seattle) are generating stronger pricing power than high-inventory markets like Houston and Miami, where thousands of listings compete for the same demand.
- The market size effect is significant: Houston’s 9,325 active STR listings face a materially different demand equation than Philadelphia’s roughly 426 licensed STRs serving a projected 149,000 visitors across six matches.
- Domestic last-minute booking demand, not the international travelers who anchor early reservations, will determine final revenue performance for the remaining tournament weeks.
The 11 World Cup host city STR markets woke up this morning with advance booking rates on game-day nights running at roughly 35% to 49% of available inventory, sitting on top of an ADR that runs approximately 48% above what these same cities were producing on comparable nights in 2025. That is the data as of opening day. Not the narrative. The data.
I have been staring at these numbers for weeks from my desk in Santa Fe, and I want to be honest with you about what they show before the first whistle blows. Some cities delivered on the advance booking strength that investors were hoping for back in April. Others have not. The spread across the 11 markets is wide enough that “World Cup host city” does not describe a single investment story. It describes eleven different ones.
Think of advance booking rates like a restaurant reservation book on the morning of a big holiday. Some restaurants are fully committed. Some have half their tables open and are counting on walk-ins. Which situation you are in matters enormously for how the night ends. And in the STR context, it also matters for how investors evaluate the remaining five weeks of tournament play.
Here is what StaySTRA data shows heading into today.
The Pre-Game Scorecard: What Advance Booking Data Shows on Opening Day
StaySTRA tracks baseline market metrics across all 11 host markets. A data transparency note before we proceed: our underlying database reflects market conditions from approximately November 2025. That is the most current structural data available on baseline occupancy, ADR, and inventory depth. For the WC-specific advance booking picture (actual game-day fill rates and booked ADR heading into June 11), I am drawing on booking pace data compiled through early June 2026.
Those two data sets together tell a complete story. The baseline shows you the market each city was operating in before the tournament began. The advance booking data shows how far World Cup demand has moved the needle.
The national picture first: across the 11 host markets, average daily rates on World Cup game-day nights are tracking approximately $287 per booked night as of opening day. The same comparable nights in 2025 ran roughly $194. That is a 48% uplift over prior year: meaningful, real money, and also considerably more modest than the 300%-plus projections circulating when tournament hype peaked in early 2026.
Stay with me here before you let that gap disappoint you. A 48% ADR increase over a comparable period is genuinely strong performance for any event demand layer. The disappointment only arrives if you built an investment thesis around projections that were always marketing estimates, not data-backed forecasts. The 48% number is the data. Plan around that.
Now to the cities.
Sponsored — Beeline
Finance Your Next STR With a DSCR Loan
Qualify on property cash flow, not W-2 income. Beeline specializes in fast DSCR closings for STR investors. No personal income verification required.
Check Your DSCR Eligibility →Affiliate disclosure: StaySTRA may earn a referral fee.
City-by-City Rankings: Which Markets Delivered on Advance Booking Strength
I ranked the 11 host markets on a combination of fill rate strength heading into opening day, ADR premium above baseline, and inventory depth relative to match count. Here is where each city stands.
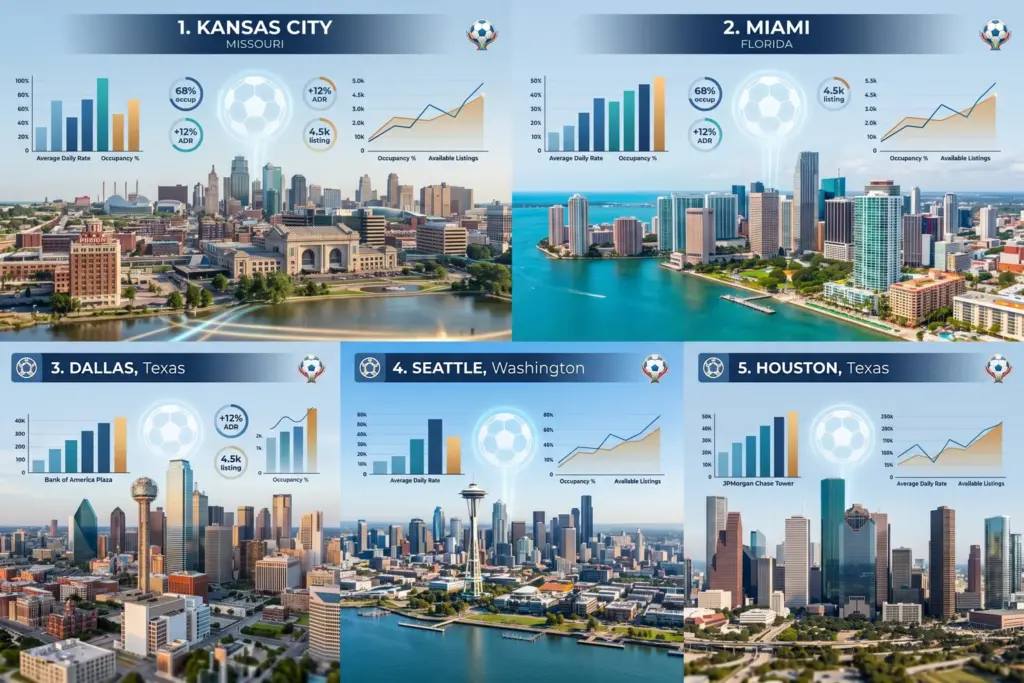
1. Kansas City, MO: The Clear Data Leader
Kansas City is the unambiguous data leader among the 11 markets. StaySTRA baseline data shows a $195 ADR market with 70% occupancy and 1,892 active listings, a compact, high-performing market by any standard. The World Cup has amplified that. Game-day advance bookings are landing at $447 to $528 per night at fill rates of 42% to 49%. That combination of pricing power and conversion rate outpaces every other city in the group.
The reasons are straightforward. Kansas City has six World Cup matches. The host inventory is small enough that demand concentration creates genuine scarcity pricing. Hosts adopted the $50 event permit required under Ordinance 250965, and that regulatory clarity reduced friction for guests and hosts alike. KC is the market that performed closest to the bullish case investors were making in early 2026.
You can check Kansas City’s current market data at the StaySTRA analyzer.
2. Seattle, WA: Quiet Strength, Constrained Supply
Seattle often gets overlooked in the World Cup conversation because it carries only four matches. But Seattle’s baseline is the strongest structural story in the entire group: $233 ADR and 86.7% occupancy across 8,738 active listings. Starting from near-87% baseline occupancy, the WC demand layer has less room to move the occupancy needle, but it has given hosts substantial pricing leverage over an already-full market. When a market is already operating near capacity, event demand translates almost entirely into pricing power rather than occupancy gains.
3. San Francisco Bay Area, CA: Regulatory Scarcity at Work
San Francisco’s STR market operates under a highly regulated framework that produces a small compliant inventory. StaySTRA data shows $267 ADR and 82.1% occupancy for the tracked universe. The supply constraint created by the city’s permitting environment means five WC matches send demand into a limited pool of licensed listings. Hosts operating in compliance here are seeing material pricing uplift with strong advance conversion rates.
4. Newark / New York City Area, NJ: The Beneficiary Market
This is the most interesting market narrative in the group, and it does not get enough attention. MetLife Stadium in East Rutherford is hosting the World Cup Final on July 19, and New York City’s Local Law 18 continues to severely restrict STR activity in the five boroughs. That policy has redirected massive demand across the Hudson. StaySTRA shows Newark at $197 ADR, 69.2% occupancy, and 2,430 active listings, an inventory that is absorbing NYC overflow demand at meaningful scale. For Final-adjacent dates, advance booking rates in the NJ corridor have been strong.
If you are evaluating properties in this corridor, our STR financing guide covers how DSCR loans work in event-dependent markets and what lenders look for when underwriting properties tied to irregular demand patterns.
Sponsored — Beeline
Finance Your Next STR With a DSCR Loan
Qualify on property cash flow, not W-2 income. Beeline specializes in fast DSCR closings for STR investors. No personal income verification required.
Check Your DSCR Eligibility →Affiliate disclosure: StaySTRA may earn a referral fee.
5. Philadelphia, PA: Supply Crunch, Conversion Challenge
Philadelphia is the most complicated data story in the group. The city has six World Cup matches and a projected 149,000 visitors. It has approximately 426 actively licensed STR properties. On paper, that ratio should produce a pricing event. The reality has been more nuanced. As of early June, more than half of Philadelphia-area STR listings remained unbooked. Hosts who priced for the international visitor who would stay five to seven nights at premium rates have found that actual demand has skewed toward domestic travelers booking shorter stays.
Don’t let that number scare you. The supply scarcity is real, and hosts who recalibrated their minimum stay requirements and pricing to match actual demand are outperforming those who held to January projections. StaySTRA’s baseline shows $171 ADR and 66.7% occupancy for Philadelphia’s tracked market, though the sample is small given the regulatory environment.
6. Atlanta, GA: A Late Demand Layer
Atlanta’s baseline is $172 ADR and 58.2% occupancy. The city has five WC matches and, as of June 10, saw the opening of Centennial Yards, a $5 billion mixed-use entertainment district that adds a non-match demand layer to the hosting window. That development is meaningful for hosts who have positioned their listings for entertainment and leisure traffic, not exclusively soccer fans. Atlanta’s total WC window revenue picture improved materially when Centennial Yards opened on the eve of opening day.
7. Los Angeles, CA: Prestige Market, Supply Constraints
Los Angeles hosts eight matches including the third-place game, making it one of the highest-profile WC venues. StaySTRA baseline data shows $242 ADR and 73.3% occupancy. The data limitation here is worth acknowledging: LA’s stringent STR permitting environment means our tracked universe is small relative to the total market. Compliant hosts are positioned well for the remaining schedule. The broader summer demand picture and WC demand are layering simultaneously in a supply-constrained environment. Check the summer 2026 STR demand data for context on how the seasonal baseline interacts with event demand in coastal California markets.
8. Boston, MA: Stable Performance Under Strict Rules
Boston’s primary-residence-only STR rules create a supply cap that operates much like Philadelphia’s permit system. StaySTRA baseline shows $221 ADR and 64.8% occupancy, with five WC matches adding supplementary demand. Advance booking data has been steady rather than spectacular. The supply constraint prevents pricing collapse, and the tight regulatory framework means compliant hosts face limited competition from new entrants.
9. Miami, FL: Strong ADR, Large Inventory
Miami carries the highest baseline ADR of any WC host market in the StaySTRA data: $325 per night, with 49% baseline occupancy and 8,743 active listings. That inventory depth is the central story. Game-day advance booking fill rates of 20% to 29%, with booked ADR of $361 to $377, represent real dollar gains over baseline. But they also mean a large share of Miami’s inventory is still available as of this morning. Miami is the most supply-rich WC market, which means individual host performance will vary more widely here than in smaller-inventory cities.
10. Dallas, TX: Nine Matches, Complicated Picture
Dallas has more World Cup matches than any other U.S. venue (nine, including a semifinal). StaySTRA baseline shows $222 ADR and 46.7% occupancy across 4,700-plus listings. Advance game-day bookings are landing at $301 to $356 with fill rates of 29% to 37%. The math works, but the spread between asking prices (many Dallas hosts listed at $600-plus) and booked rates reflects a market that has been recalibrating for weeks.
If you are financing Dallas STR properties with a DSCR loan, the complete guide to STR financing covers how lenders underwrite Texas markets, including the considerations around local regulatory uncertainty.
Sponsored — Beeline
Finance Your Next STR With a DSCR Loan
Qualify on property cash flow, not W-2 income. Beeline specializes in fast DSCR closings for STR investors. No personal income verification required.
Check Your DSCR Eligibility →Affiliate disclosure: StaySTRA may earn a referral fee.
11. Houston, TX: The Weak Link
Houston trails the field heading into opening day. StaySTRA baseline shows $159 ADR (the lowest in the group) and 51.6% occupancy across 9,325 active listings. That inventory volume, combined with new STR compliance requirements that surprised many casual hosts, has produced advance booking fill rates around 34%. Houston has five WC matches. The math is workable for well-positioned, compliant hosts, but the city is not delivering the event premium that investors projected twelve months ago.
The Market Size Effect: Why Inventory Volume Changes the Entire Picture
The pattern that stands out most clearly when you view all 11 markets together is the one that matters most for investors watching the remaining tournament weeks.
Think of a market’s STR inventory as the capacity of a concert venue. If you have a 500-seat venue and 400 tickets confirmed, you are at 80% occupancy with real pricing power for the remaining seats. If you have a 10,000-seat venue with 3,400 tickets sold, you are at 34%, and the pricing dynamics are completely different, even if the same act is performing.
That analogy describes the Houston and Philadelphia situations almost exactly. Houston has 9,325 listings running at 34% fill rates on WC nights. Philadelphia has roughly 426 licensed STRs. And even with conversion challenges, this market operates at a scarcity premium that Houston cannot replicate regardless of pricing strategy.
The same dynamic explains, in a less extreme form, why Kansas City (1,892 listings, 42-49% fill rates) outperforms Miami (8,743 listings, 20-29% fill rates) even though Miami carries more matches and a higher baseline ADR. Inventory concentration creates pricing power. Inventory abundance dilutes it.
For context on how these markets were performing before World Cup demand arrived, the Q1 2026 STR market performance data provides the pre-tournament baseline for most of these cities.
What Investors Watching Today Should Know About Remaining Tournament Weeks
Opening day is a data snapshot, not a final score. Here is what the advance booking picture signals for the six weeks ahead.
Domestic last-minute demand will matter more than the models assumed. International booking patterns have shown 26% to 35% conversion rates against the 40% to 50% that early projections assumed. That gap means most host cities are relying on domestic travelers (particularly from nearby regional markets) to fill remaining inventory in the days before each match. Hosts who have adapted minimum stay requirements from five-night floors to two or three nights for non-final match clusters are capturing bookings that rigid strategies are forfeiting.
The Final window is its own market. The Newark and NJ corridor have the highest-stakes tournament event still ahead of them. For Final-adjacent dates in the MetLife corridor (July 14-19), advance booking data suggests pricing has room to move further before inventory clears.
Kansas City, Seattle, and San Francisco remain the markets to watch for sustained RevPAR performance. These three cities are generating the best combination of occupancy and pricing premium relative to their baselines. They are demonstrating what supply-constrained, high-performing STR markets do during major events: they capture pricing and fill simultaneously, rather than trading one for the other.
Houston and Miami hosts should prioritize conversion over rate. With large supply and mid-range fill rates, confirmed bookings at current market rates will outperform empty listings held at aspirational prices. A $300 confirmed booking is worth more than a $500 rate card no one is clicking.
Run the numbers on your specific host city property at the StaySTRA analyzer. WC market data is updated as new booking pace data becomes available.
Frequently Asked Questions
Which World Cup 2026 host city has the best STR booking performance heading into opening day?
Kansas City, Missouri leads the 11 host markets on combined booking strength. Game-day advance bookings are landing at $447 to $528 per night with fill rates of 42% to 49%, the strongest combination of pricing premium and conversion rate in the group. Kansas City’s compact licensed inventory of roughly 1,892 active STR listings, relative to its six World Cup matches, has created genuine supply scarcity that supports pricing power.
How does World Cup STR demand compare to typical June performance in host cities?
Game-day advance bookings across the 11 host cities are running at average daily rates approximately 48% above comparable June 2025 figures: roughly $287 per booked night versus $194 in the prior year period. That uplift is real and represents meaningful incremental revenue for hosts in well-positioned markets. It is considerably below the 300%-plus projections that circulated in early 2026, which reflected aspirational pricing rather than actual demand behavior.
Why is Houston underperforming other World Cup host cities on STR booking data?
Houston’s STR market has 9,325 active listings (the largest inventory among the 11 host cities) against five World Cup matches. That supply-to-demand ratio dilutes the pricing power that smaller-inventory markets generate. Houston also faced significant STR compliance challenges in 2026, including insurance requirements that reduced the pool of actively compliant listings available for WC bookings. Advance fill rates are tracking around 34%, the lowest in the group.
Does the World Cup Final at MetLife Stadium affect Newark and New Jersey STR performance?
Yes, significantly. MetLife Stadium in East Rutherford hosts both a semifinal on July 14 and the World Cup Final on July 19. New York City’s Local Law 18, which severely restricts short-term rentals in the five boroughs, has redirected substantial demand to the Newark and broader NJ corridor. StaySTRA shows Newark at 69.2% baseline occupancy with 2,430 active listings, well-positioned to absorb that overflow, particularly for Final-adjacent dates where advance booking strength has been strongest.
What does the World Cup booking data mean for investors evaluating remaining tournament weeks?
The advance data as of opening day signals that Kansas City, Seattle, and San Francisco are the markets most likely to sustain strong RevPAR performance through the remaining schedule. They combine constrained supply with solid fill rates and pricing premiums. In high-inventory markets like Houston and Miami, the strategic focus should shift to confirmed conversion over rate optimization. The Final window at MetLife (July 14-19) represents the last major pricing opportunity in the Newark and NJ corridor.
We do our best to keep our data accurate and up to date, but markets move fast and we are only human. StaySTRA baseline market data reflects approximately November 2025 figures; World Cup advance booking data compiled through early June 2026. Always verify current figures directly with local sources before making investment decisions.
Become a StaySTRA Insider
Join free — get our newsletter + 1 free property analysis/month.
No spam. Unsubscribe anytime. Free membership includes property analyses and market insights.


