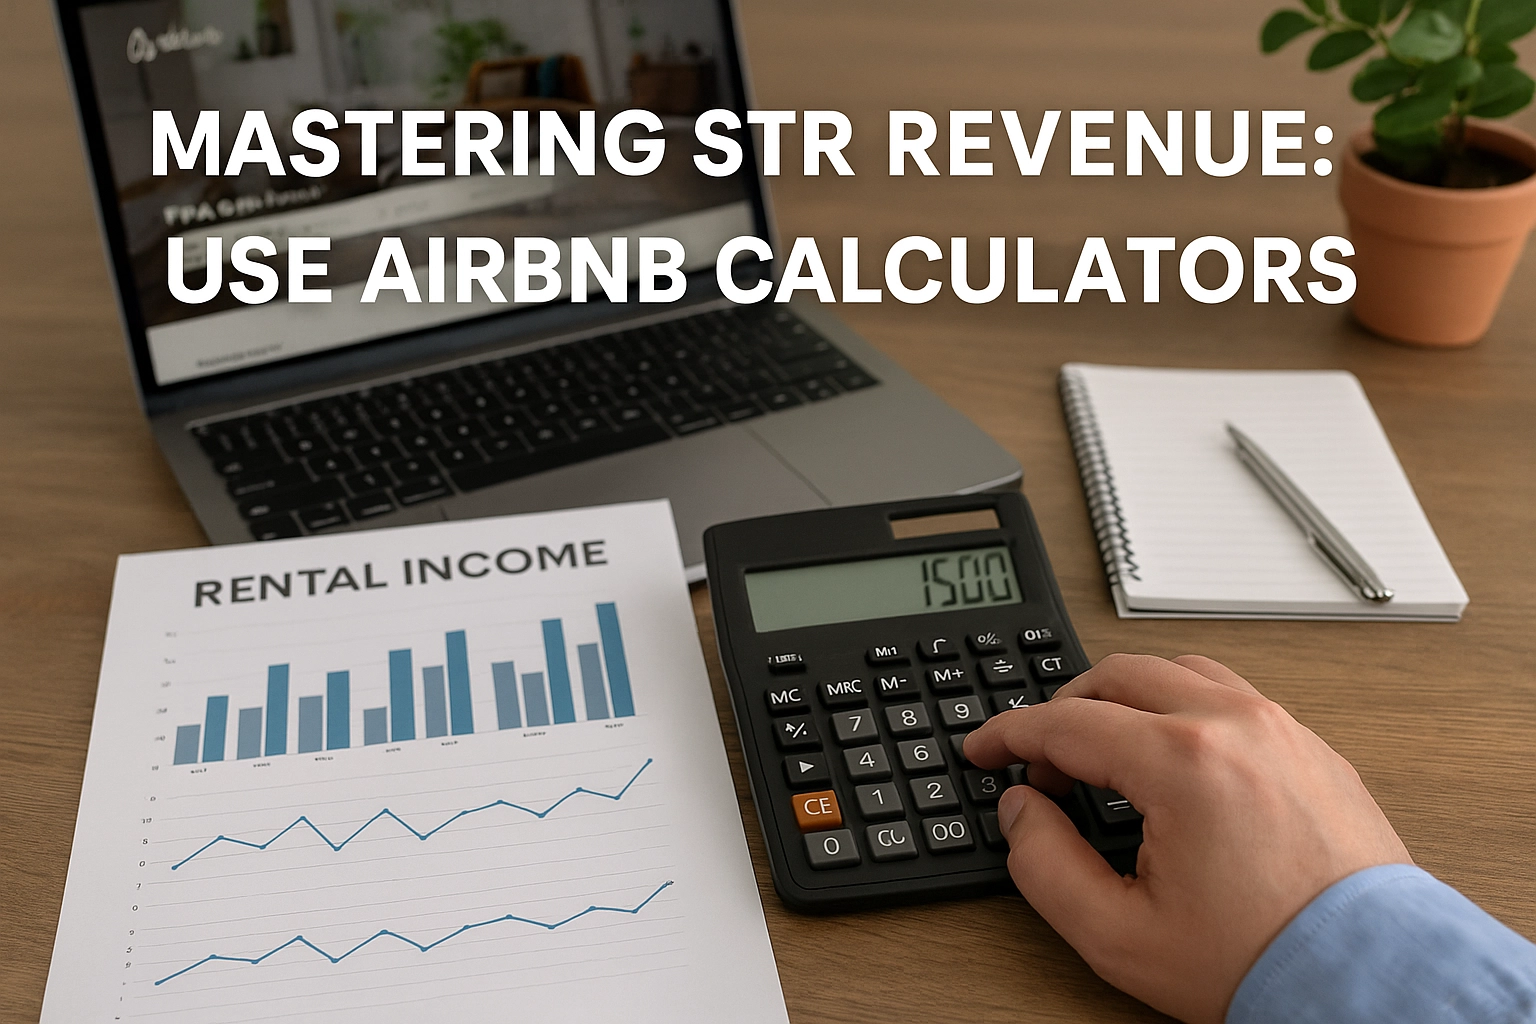
Category: Data

  • Average Daily Rates (ADR) for short-term rentals are climbing!

    Average Daily Rates (ADR) for short-term rentals are climbing!

    Hello everyone, Edna Stewart here. It’s a pleasure to connect with you again from my desk here in Santa Fe. As the Senior Data Analyst and Research Editor for our publication, I spend my days looking at numbers and trends in the short-term rental world. Today, I want to share some interesting findings about how nightly prices have changed over the past year in certain areas.

    We’ll be looking at something called the Average Daily Rate, or ADR. Think of ADR like the average price tag you see on a rental for one night’s stay, once it’s actually booked. By comparing the ADR from last year (2024) to this year (2025) in different markets, we can see where prices are heading.

    Our latest data shows some significant jumps in certain cities. Let’s dive into which places saw the biggest increases.

    What Do Rising Rates Tell Us?

    When we see the average nightly rate go up quite a bit in a specific city, it often points to a few things. It might mean more travelers want to visit that place, perhaps because of its attractions, natural beauty, or local events. It could also suggest that the number of available rentals hasn’t kept pace with the number of people wanting to book them. Sometimes, local regulations or economic factors can also play a role.

    Looking at our list, it’s hard not to notice a theme: mountain destinations and cities in California are seeing some of the most substantial price growth right now. This often happens in desirable areas where people love to vacation, hike, ski, or just enjoy the scenery.

    The Biggest Movers: Where Prices Jumped the Most

    Let’s look at the stars of this particular dataset – the places where the average cost per night saw the largest increases compared to last year.

    • Leading by Dollars: Topping the list for the biggest dollar increase is Park City, Utah. Guests there are paying, on average, a substantial $223 more per night than last year, bringing the ADR up to nearly $640! That’s quite a leap. Other big dollar jumps happened in Steamboat Springs, Colorado (up $211) and Breckenridge, Colorado (up $207).
    • Leading by Percentage: When we look at the biggest percentage jump, Breckenridge, Colorado leads the way with a nearly 64% increase in its ADR! Close behind are Santa Clarita, California (up almost 61%) and Steamboat Springs, Colorado (also up about 61%). These kinds of percentage increases mean the nightly rate grew very quickly relative to what it was last year.

    It’s fascinating to see some places, like Steamboat Springs and Breckenridge, appearing high on both the dollar and percentage increase lists. This signals really strong price momentum in those markets.

    Top 10 Cities for ADR Growth (2024 vs. 2025)

    Here are the ten cities from our data that showed the largest increases in Average Daily Rate over the past year. I’ve included the new average rate for 2025 and the percentage increase from 2024. If you’d like to explore more data about any of these specific cities, just click the link!

    1. Park City, Utah: $639.75/night (+53.6%)
    2. Steamboat Springs, Colorado: $558.91/night (+60.7%)
    3. Breckenridge, Colorado: $530.82/night (+63.9%)
    4. Frisco, Colorado: $493.77/night (+50.0%)
    5. Santa Clarita, California: $393.80/night (+60.9%)
    6. South Lake Tahoe, California: $475.82/night (+35.2%)
    7. Rancho Cucamonga, California: $366.00/night (+47.0%)
    8. Fullerton, California: $384.96/night (+34.1%)
    9. Big Bear Lake, California: $442.56/night (+28.0%)
    10. Key West, Florida: $594.38/night (+18.5%)

    (Data reflects changes comparing 2024 ADR to 2025 ADR)

    What This Means for You

    If you’re a host in one of these areas, this trend could mean higher potential earnings from your rental. It reflects strong demand. For travelers planning trips to these popular spots, it signals that budgeting for accommodation might require a bit more planning, as nightly rates have climbed noticeably.

    Understanding these shifts helps everyone involved in the short-term rental market make more informed decisions. I’ll keep watching the data, and I look forward to sharing more insights with you soon!

    StaySTRa Insider
    Name
  • Ireland’s STR Playbook: Big Numbers, Big Questions, and What the US Needs to Know

    Ireland’s STR Playbook: Big Numbers, Big Questions, and What the US Needs to Know

    Alright, let’s talk straight. Across the pond in Ireland, they’re wrestling with the same things we see right here in our neighborhoods: the boom of short-term rentals (STRs). We’ve got a new pile of research, including a big study paid for by Airbnb, shouting some impressive numbers about money and jobs. But what’s the real story behind the headlines, and what can towns and cities across America learn from Ireland’s experience? As your community impact correspondent, I dug in.

    The Shiny Numbers – What the Big Study Says

    First, let’s talk money, because the numbers are eye-popping. The study by Oxford Economics claims that in 2022, Airbnb activity pumped a whopping €501 million ($540 million USD approx.) into Ireland’s economy. Think about that – half a billion euros! They say it supported nearly 5,000 jobs across the country.

    Where did this cash come from? Guests spending money. The report estimates they spent €537 million ($580 million USD approx.) – partly on their stays, putting money directly into hosts’ pockets (around €255 million), and partly splashing out in local shops, pubs, and restaurants (over €180 million).

    Here’s something interesting for our own communities: the study says STRs are helping spread tourism dollars beyond the usual big city hotspots. In Ireland, Dublin’s share of Airbnb nights apparently dropped significantly, while regions out west and southwest saw big gains. Could STRs be a lifeline for smaller towns here in the US, bringing in visitors who might otherwise never stop by?

    And let’s not forget the hosts. The typical Irish host reportedly earned just over €5,600 (about $6,000 USD) in 2022. For many families, especially when costs are rising everywhere, that extra income isn’t just nice-to-have; it’s a vital buffer helping them make ends meet or fix up their homes. That’s a powerful community impact right there.

    Making sense of all this – the opportunities, the rules, the local market buzz – isn’t easy, is it? We’ve seen how places like Ireland are grappling with data and regulations, and getting that kind of clarity here in the US is crucial for homeowners trying to host responsibly. You need more than just headlines; you need real insights tailored to your specific area. Thankfully, tools are emerging to help cut through the noise. If you’re looking for detailed information to make smarter decisions about short-term rentals, one resource worth checking out is the StaySTRa Analyzer. Because having the right facts on the ground is the first step to navigating this landscape effectively, wouldn’t you agree?

    The Elephant in the Room – Housing Worries

    Now, let’s be real. Ireland, like many places in the US, is facing a tough housing situation. Rents are high, finding a place to live is hard, and some folks are pointing fingers at STRs, asking: are they taking homes off the long-term market?

    Housing groups like Threshold in Ireland raise alarms, showing numbers like over 20,000 entire homes listed as STRs compared to very few available long-term rentals. They worry about big operators buying up properties just for STRs. It’s a serious concern we hear in American cities too. Are STRs making it harder for local families to find a place to call home?

    But hold on, the picture gets complicated. Ireland’s own research institute (ESRI) looked into it and found no clear nationwide link showing STR growth directly caused the drop in long-term rental listings across the whole country. They did say STRs could be having a negative impact in specific local areas, especially tourist hotspots where lots of rentals are concentrated. They also found many STRs, particularly outside cities, used to be holiday homes anyway – meaning they might never have been rented out long-term.

    And that Airbnb-funded study? It argues STRs are just a tiny fraction – less than 0.5% – of the total housing stock in big European cities. Their point: even if every single STR went back to long-term housing, it wouldn’t drastically change prices overall.

    So, who’s right? The truth is probably messy. STRs likely aren’t the main villain driving housing shortages nationwide, but in certain popular neighborhoods, they definitely add pressure. The question isn’t if STRs have an impact, but how much, where, and what’s the best way to manage it without throwing the baby out with the bathwater?

    Rules of the Road – Ireland’s Plan (and Delays)

    Ireland knows it needs clearer rules. They’re working on a national sign-up sheet – a register – for all STR properties. The idea is simple: get everyone listed, give them a number, and make platforms like Airbnb check that number before allowing bookings. Fáilte Ireland, their tourism authority, is set to run it. This is supposed to bring transparency, help enforce existing rules (like needing planning permission in certain zones), and maybe nudge some properties back to the long-term market.

    Sounds sensible, right? It aligns with new rules coming from the European Union, aiming for consistency across countries. Platforms will have to share data, and there will be penalties for breaking the rules – both for hosts and the platforms themselves.

    But here’s the kicker: it’s delayed. Badly. Why the holdup? It seems politicians are stuck in a tug-of-war – trying to fix housing problems without hurting tourism, especially in rural areas that depend on those visitor dollars. This delay causes confusion and frustration. While they argue, who is making sure the current rules are even followed? It raises a big question: What good are rules if nobody enforces them?

    Lessons for Main Street USA

    So, what does Ireland’s rollercoaster ride mean for us here in the States?

    1. STRs = Real Economic Fuel: Don’t dismiss the dollars. Ireland’s numbers show STRs can bring serious money into local economies, support jobs, and help homeowners earn crucial income. We see this in countless American towns too.
    2. Spreading the Love: The idea that STRs can push tourism beyond big cities is compelling. For smaller US communities looking for a boost, STRs could be a powerful tool if managed right.
    3. Housing is Complex: Blaming STRs entirely for housing shortages is too simple. Yes, they can have an impact, especially in hotspots. But the Irish research suggests the reality is nuanced. We need good data, not just assumptions.
    4. Registration is Key: Ireland’s move towards a national register, matching the EU trend, makes sense. Knowing who is hosting where is the first step towards fair oversight. US cities are already doing this – think Alexandria, VA or Raleigh, NC. It provides transparency.
    5. Smart Rules, Not Sledgehammers: The goal should be balanced regulation. Outright bans or overly strict caps (like Amsterdam’s 30-day limit, which didn’t solve housing but hurt hosts) might be throwing away economic benefits. The focus should be on:
      • Simple, clear registration.
      • Using data to understand local impacts.
      • Enforcing basic rules (safety, taxes, nuisance).
      • Targeting problematic operators (like commercial landlords running illegal hotels), not everyday folks sharing their homes.
    6. Don’t Get Stuck: Ireland’s delays show that political deadlock helps no one. We need clear rules that people can actually follow, implemented fairly and without endless waiting.

    Ireland’s story is a work in progress. They’re showing that STRs offer real opportunities but also raise genuine community questions. The challenge – for Ireland and for us – is to find that sweet spot: rules that protect neighborhoods and housing without crushing the economic engine and the property rights of homeowners sharing their space. Let’s learn from their experience, demand good data, and craft fair, enforceable rules that allow responsible short-term rentals to thrive alongside our communities. Are our local leaders ready to have that honest conversation?

    StaySTRa Insider
    Name
  • Dripping Springs Short Term Market Overview: April 2025

    Dripping Springs Short Term Market Overview: April 2025

    Hello again, it’s Edna Stewart. As a data analyst who has spent nearly four decades looking at market trends, I always find it interesting to explore the stories hidden within the numbers. Today, we’ll turn our attention to Dripping Springs, Texas, another beautiful spot in the Hill Country. Using the latest information from our trusted data partner, StaySTRa.com, let’s see what the short-term rental market looks like there as of April 2025.

    Rapid Growth, Recent Plateau?

    Dripping Springs has seen remarkable growth in its short-term rental scene. Back in April 2014, StaySTRa.com tracked only 4 listings. Think about that! Just four places available. By April 2024, that number had surged to 665 listings. It’s clear that Dripping Springs became a popular place for both visitors and rental hosts. However, the most recent count in January 2025 shows 642 active rentals, a slight dip from the peak. It will be interesting to watch if this leveling-off continues.

    What Rentals Look Like in Dripping Springs

    Similar to nearby areas, the vast majority of rentals here are ‘Entire Place’ options – StaySTRa.com counts 544 of them. This means guests typically get a whole house, cabin, or apartment to themselves. There are far fewer Private Rooms (35 listings) and only a single Hotel Room listed in this dataset.

    What about size? The average rental in Dripping Springs accommodates about 7 people (6.9 guests) and has between 2 and 3 bedrooms (2.6 bedrooms on average). This suggests properties might be slightly larger on average compared to some other Hill Country towns, making them well-suited for families or groups attending events, perhaps like weddings, which Dripping Springs is known for.

    How Often Are Rentals Booked? (Occupancy)

    Occupancy tells us how frequently properties have guests. Over the last twelve months (LTM), the typical (median) ‘Entire Place’ rental in Dripping Springs was booked about 38.7% of the time (LTM Occ: 0.387…). So, for every 10 nights available, just under 4 were booked, on average. This is a bit lower than some neighboring markets.

    Looking at recent months, March 2025 saw occupancy rise to around 48.4% (0.4838…), which is common as weather improves and travel picks up. However, the winter months were slower – January 2025 had a median occupancy of only 25.8% (0.258…), and February was around 30% (0.3…).

    What Does It Cost to Stay? (Average Daily Rate – ADR)

    How much does a night cost? The Average Daily Rate (ADR) gives us that picture. Over the last twelve months, the median ADR for an entire place was $261 (LTM ADR: 261).

    Like occupancy, rates fluctuate. March 2025 saw a median ADR of $264.23. Interestingly, April 2024 had a higher median ADR at $295.60, while rates dipped in late summer/early fall 2024 (around $250-$270). This shows how prices adjust based on demand throughout the year.

    How Much Can Hosts Earn? (Revenue)

    When we combine how often a place is booked (occupancy) with the nightly rate (ADR), we get the monthly revenue. For the past year, the typical (median) monthly revenue for an entire place rental in Dripping Springs was $2,432 (LTM Revenue: 2432).

    Again, seasonality plays a big role. March 2025 brought in median revenue of $3,185.50. But the slower winter months saw significantly lower earnings, like January 2025 with a median of just $1,493. August and September 2024 were also notably low, around $1,840-$1,845.

    Understanding Demand

    StaySTRa.com provides a “Rental Demand” score, which for Dripping Springs is currently 33.21. Compared to other areas we’ve looked at, this score suggests a somewhat lower level of organic rental demand. This aligns with the lower overall occupancy rate we observed. For those wanting to dig deeper into metrics like these, the StaySTRa Analyzer is a great resource. You’ll often find these properties listed on platforms like Airbnb and VRBO.

    Looking Ahead

    The Dripping Springs short-term rental market shows a history of strong growth, though recent data might suggest a potential leveling off in supply. Rentals tend to be slightly larger family- or group-sized homes. While nightly rates are solid, overall occupancy and resulting monthly revenues appear lower than in some nearby Hill Country destinations, with significant seasonal dips, particularly in winter and late summer.

    Considering investing or hosting in Dripping Springs? Understanding these trends is vital. We always recommend connecting with a local real estate professional who knows the nuances of the short-term rental market in this specific area. They can offer tailored guidance.

    Don’t forget to check back with us next month for fresh data and insights on Dripping Springs and other markets!

    Name

    TL;DR Dripping Springs STR Market (April 2025):

    • Growth: Huge increase from just 4 rentals in 2014 to ~650 now, but recent numbers show a slight plateau/dip.
    • Typical Rental: Mostly entire homes, average size fits ~7 people (2-3 bedrooms), slightly larger than some neighbors.
    • Last Year’s Performance (Median):
      • Booked about 39% of the time (Occupancy) – lower than some nearby areas.
      • Average nightly rate was $261 (ADR).
      • Typical monthly earnings were $2,432 (Revenue) – impacted by lower occupancy.
    • Seasonality: Clear busy (Spring) and slow (Winter, late Summer) periods impacting bookings and earnings significantly. Jan 2025 revenue was particularly low ($1493).
    • Data Source: StaySTRa.com

    In short, Dripping Springs has grown fast but might be stabilizing. Rentals are often larger homes, but they get booked less often than in some nearby towns, leading to lower typical monthly revenue despite decent nightly rates. Watch out for the slow seasons!

  • Wimberley Short Term Market Overview: April 2025

    Wimberley Short Term Market Overview: April 2025

    Hello there, I’m Edna Stewart, your guide through the world of short-term rental data. With many years spent looking at numbers and market trends, I find it fascinating to see how places like Wimberley, Texas are growing and changing. Today, let’s take a calm look at what the data tells us about Wimberley’s short-term rental market as of April 2025. All the information we’ll discuss comes directly from our trusted source, StaySTRa.com.

    A Growing Destination

    Wimberley has certainly become more popular over the years for visitors looking for a getaway. Think back to April 2014 – the data shows there were only about 20 short-term rentals listed. Fast forward ten years to April 2024, and that number jumped significantly to 875 listings! As of January 2025, StaySTRa.com tracked 886 active rentals. This tells us that more homeowners are seeing the opportunity to share their properties, and likely, more guests are discovering the charm of Wimberley.

    What Rentals Look Like in Wimberley

    So, what kind of places are available? Most rentals in Wimberley are ‘Entire Place’ listings – 747 of them, to be exact, according to StaySTRa.com. This means guests usually rent the whole house or cabin, not just a room. There are also some Private Room (68 listings) and a few Hotel Room (19 listings) options.

    On average, these rentals can host about 6 people (6.3 accommodates) and typically have 2 or 3 bedrooms (2.4 bedrooms on average). This makes Wimberley a great spot for families or small groups looking for a comfortable stay.

    How Often Are Rentals Booked? (Occupancy)

    Occupancy tells us how often properties are rented out versus sitting empty. Over the last twelve months (LTM), the typical (median) Wimberley rental was booked about 46.2% of the time (LTM Occ: 0.4615…). Think of it like this: for every 10 nights available, a typical rental was occupied for just over 4 and a half nights.

    Looking at recent months, March 2025 saw a higher occupancy rate, with the median property being booked about 58.1% of the time (0.5806…). This makes sense as spring often brings more visitors. January and February 2025 had lower rates, around 29% and 33% respectively, which is common for the post-holiday season.

    What Does It Cost to Stay? (Average Daily Rate – ADR)

    The Average Daily Rate, or ADR, is simply the average price paid per night. For the last twelve months, the median ADR in Wimberley was $251 (LTM ADR: 251).

    Rates do change with the seasons. For example, StaySTRa.com data shows the median ADR for March 2025 was higher at $261.10, while back in January 2025, it was a bit lower at $246.29. This shows that prices adjust based on demand, often higher during peak travel times.

    How Much Can Hosts Earn? (Revenue)

    Putting occupancy and nightly rates together gives us revenue – the amount hosts typically earn per month. Over the last year, the median monthly revenue for an entire place rental was $3,104 (LTM Revenue: 3104).

    Again, this varies month by month. March 2025 was a strong month with median earnings around $4,153, likely due to higher occupancy and rates. In contrast, January 2025 saw median revenue closer to $2,207. Summer months like July 2024 also showed strong earnings, reaching a median of $4,222.

    Understanding Demand

    StaySTRa.com gives Wimberley a “Rental Demand” score of 42.75. While this specific score requires deeper context, it generally suggests a moderate level of demand compared to other markets. Keeping an eye on how this score changes can help understand market dynamics. You can explore detailed metrics like this using tools like the StaySTRa Analyzer. Properties are often listed on popular platforms such as Airbnb and VRBO.

    Looking Ahead

    The data paints a picture of a growing, moderately busy short-term rental market in Wimberley, with clear seasonal patterns in bookings and pricing. The typical rental is a whole house suited for small groups or families.

    Understanding these numbers is key whether you’re a host, an investor, or planning a visit. Remember, markets change, so it’s always good to stay updated.

    Thinking about buying, selling, or optimizing a short-term rental in Wimberley? Market knowledge is crucial. We recommend connecting with a local real estate agent who specializes in vacation rentals. They can provide personalized advice based on your specific goals.

    Be sure to check back with us next month for another update on Wimberley and other markets!

    Talk To A Local Agent
    Name

    LT:DR Wimberley STR Market TL;DR (April 2025):

    • Growth: The number of rentals has boomed, from just 20 in 2014 to nearly 900 today.
    • Typical Rental: Mostly entire homes, averaging 2-3 bedrooms and hosting about 6 guests.
    • Last Year’s Performance (Median):
      • Booked about 46% of the time (Occupancy).
      • Average nightly rate was $251 (ADR).
      • Typical monthly earnings were $3,104 (Revenue).
    • Seasonality Matters: Bookings and rates spike in spring and summer (March 2025 was strong), lower in winter (Jan/Feb 2025 were slower).
    • Data Source: StaySTRa.com

    Basically, Wimberley is a popular, growing market, especially for family-sized rentals, with clear busy and slow seasons impacting how often places are booked and what hosts earn.

  • Is This Short-Term Rental Worth It? How to Instantly Analyze Any Property in Under 30 Seconds

    Is This Short-Term Rental Worth It? How to Instantly Analyze Any Property in Under 30 Seconds

    Most STR investors waste hours guessing whether a property will perform. We built a tool that does it in 30 seconds. Here’s how it works—and why hundreds of smart buyers are already using it.

    The Problem:

    You find a promising listing. It looks like an Airbnb winner. But is it?

    • Will it actually cash flow?
    • What’s the STR income potential?
    • Is the market oversaturated?
    • What kind of guests even book here?

    Most platforms don’t give you those answers. Or they hide it behind a paywall.
    That’s why we built StaySTRA Analyzer—the fastest way to get the real picture, without logging into any platforms or decoding cryptic maps.

    The Solution:

    Input panel for StaySTRa Analyzer
    Input panel for StaySTRa Analyzer

    Just drop in the address.
    Our tool gives you:

    • Market-level scores (saturation, seasonality, strength)
    • Local STR income projections
    • A custom STR Value Index
    • Submarket heatmap and trends (in dev)
    • And it’s growing every week

    It’s free. No fluff. No guru-speak. Just raw, useful data.

    Let’s say you’re looking at this property:
    285 Sierra Loma, Wimberley, TX

    Property Summary for StaySTRa Analyzer
    Property Summary for StaySTRa Analyzer

    This address popped up in our inbox this week. Within seconds, the Analyzer told us:

    • Market Score: 8.2/10
    • Estimated Annual STR Income: $82,400
    • Submarket Tilt: Hot but not oversaturated
    • Property Type: Top-performing 3BR, strong weekend demand

    This is the kind of quick check you need before you waste time calling agents or running comps.

    Ready to See the Numbers on Your Next STR?

    Don’t waste hours guessing.
    Drop in any property address and get real short-term rental income projections, market scores, and investment insights—in under 30 seconds.

    ➡️ Try the StaySTRA Analyzer now. No login. No fluff. Just data.
    Start Analyzing »

    And if you want early access to bonus tools, hot leads, and our weekly “Top STRs” newsletter—subscribe below.

    Name

    P.S. We’re quietly building the most useful STR data hub on the web. No gurus, no fluff, just a team obsessed with clarity and cash flow. If that sounds like your vibe, stick around.